

Introduction
In the first part of this series, we examined the “address already in use” error – a local issue that occurs before any network traffic is sent. In this second part, we move from local socket binding to the beginning of network communication, focusing on the “connect timeout” error.
A “connect timeout” error occurs when a client attempts to establish a TCP connection but receives no response at all from the destination – not a SYN + ACK and not a RST. This silence is typically caused by firewalls dropping packets, incorrect routing, unreachable subnets, or filtering devices that block traffic without sending feedback. Understanding this error requires revisiting the mechanics of the TCP three-way handshake and how retransmissions work when the initiating SYN never reaches a responsive endpoint.
As in the rest of this series, the discussion is structured into three subsections:
- TCP Insights – explains the handshake behavior and retransmission rules relevant to timeouts.
- Error Behavior – illustrates what happens when SYN packets go unanswered.
- Troubleshooting – provides practical tools and techniques for determining where packets are being dropped and why.
All demonstrations are based on the TCP/IP & DNS Sandbox Git repository, which includes Python applications and an optional AWS environment for reproducing these scenarios. Whether you run the sandbox in AWS or locally, the examples show exactly how a connect timeout appears in tools like tcpdump, Wireshark, and connectivity tests such as nc or PowerShell’s Test-NetConnection.
TCP Insights
Before exploring connection-related errors, it’s useful to recall how a TCP connection is established and how the protocol identifies each session. A TCP connection begins with a three-step handshake between a client and a server:
- The client initiates the connection by sending a TCP segment with the SYN (synchronize) flag set.
- The server responds with a segment containing both SYN and ACK flags, acknowledging the client’s request.
- The client completes the handshake by sending a final ACK, confirming the connection establishment.
After these three packets, the connection is fully established and both sides can start exchanging application data. The diagram below illustrates this handshake, showing both the IP and TCP headers for each direction of communication.
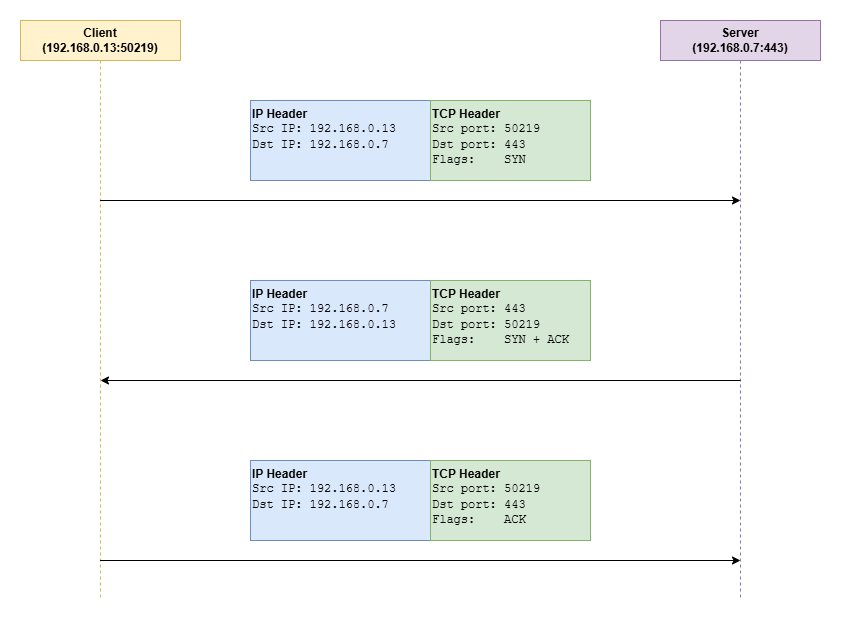
Each TCP connection is uniquely identified by a quartet of four values, also known as the TCP four-tuple. Each endpoint of the connection contributes an IP address and a TCP port. In the previous diagram, the client endpoint uses IP address 192.168.0.13 and TCP port 50219, while the server endpoint uses IP address 192.168.0.7 and TCP port 443. Depending on the direction of communication, each IP address appears alternately as the source or destination address, and the same alternation applies to the TCP ports.
Understanding this quartet is essential when interpreting network traces and socket tables.
Troubleshooting tools such as Wireshark, tcpdump, netstat, or ss display these four values to identify individual TCP sessions, so being familiar with them is a prerequisite for correct interpretation of the captured data. Network devices such as firewalls and Network Address Translation (NAT) systems also rely on this same four-tuple to track and route connections accurately.
Error Behavior
When a firewall or other network device blocks the traffic, the initial SYN segment of the TCP handshake never reaches the destination. Because of this, the server never sends a response, and the client is left waiting for a reply that will never arrive. During this waiting period, the client’s TCP stack performs several retransmissions of the SYN segment at increasing intervals, hoping for an acknowledgment. If none is received before the application-defined timeout expires, the connection attempt fails with a connection timeout error as illustrated by the following diagram.
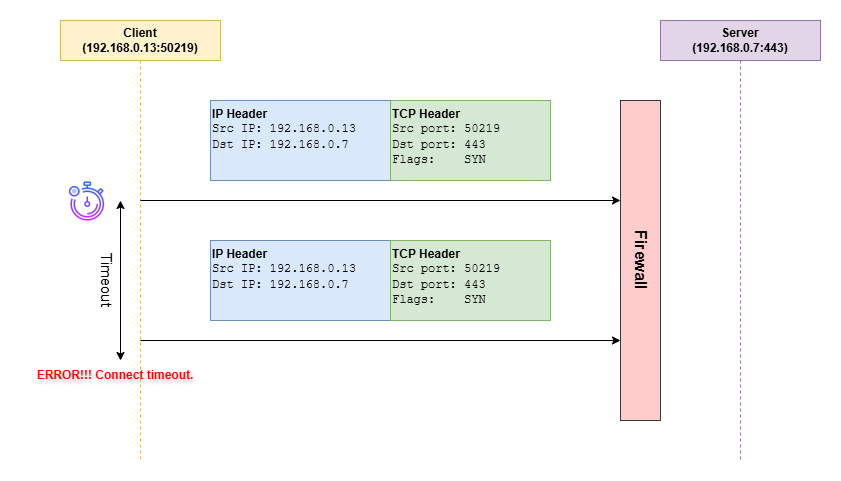
This type of error typically indicates that packets are being dropped silently somewhere between the client and server – either due to firewall rules, or because of routing issues. Because no TCP-level response is received, this scenario is sometimes called a blackhole drop.
Troubleshooting
A connection timeout error almost always points to a network reachability or filtering issue. The absence of any reply to the initial SYN segment usually indicates that a firewall or router is silently dropping the packets, or that a routing problem prevents them from reaching the destination.
- Use ping to test the reachability of the destination IP address. Keep in mind that ping uses the ICMP protocol, not TCP. If it succeeds, you know that the network interface associated with the destination IP address is reachable – there is proper routing, and the target host is up and running. However, a successful ping does not guarantee that TCP traffic to the destination port is allowed. If ping fails, it might simply mean that ICMP is blocked, so the diagnostic value of a failed ping is limited.
- Check whether other TCP or UDP traffic can reach the destination IP address. If such traffic succeeds, the destination IP address is reachable, the network interface is up, and routing is functional.
- When testing TCP traffic, the nc (netcat) tool or the Test-NetConnection PowerShell cmdlet can be useful.
- If no traffic (ICMP, TCP, or UDP) reaches the destination, verify that the target host is running and that its network interface associated with the destination IP address is active.
- Examine firewalls and security filters, especially if the ping test succeeds or if other traffic types (TCP or UDP) reach the host. In these cases, packet filtering is the most likely cause of the timeout.
- Use packet capture tools such as tcpdump or Wireshark to observe what happens to your SYN packets. If you see repeated outgoing SYN segments without any responses, the packets are likely being dropped somewhere along the path. In contrast, if you see a RST response, the issue is not a timeout but a connection refused scenario.
To illustrate how the “connect timeout” error occurs in practice, we will use the TCP server and TCP client applications from the TCP/IP & DNS Sandbox repository. The demo runs on the AWS infrastructure provisioned by the accompanying Terraform configuration, but the applications behave the same way in any environment.
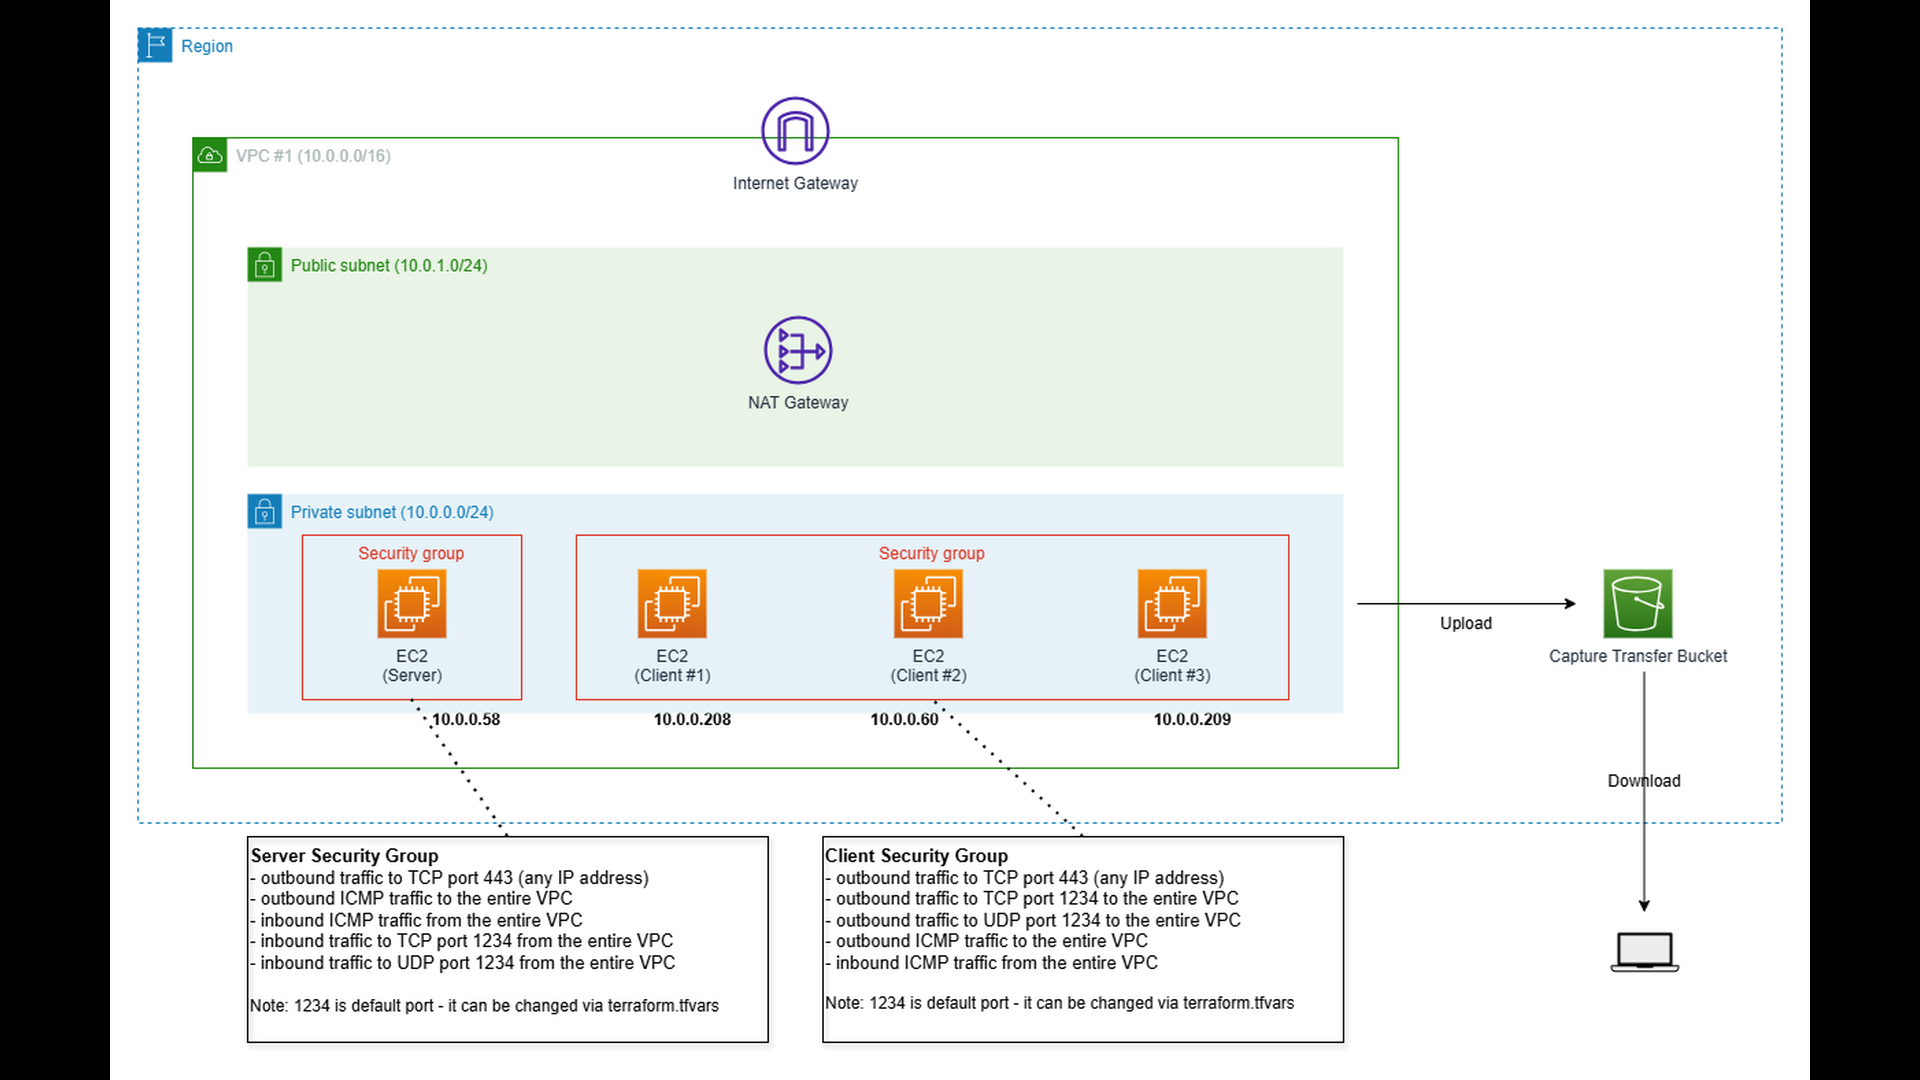
The following diagram shows the AWS infrastructure used for this demonstration. There is a single EC2 instance meant to run the TCP server application, and there are three EC2 instances meant to run instances of the TCP client application. All EC2 instances are located in the same subnet. Network access between the instances is strictly controlled using security groups, which makes it possible to simulate different connectivity scenarios in a deterministic way. The diagram also shows the IP addresses automatically assigned to the EC2 instances for this demonstration. These addresses will later be visible in the network captures. Note that the IP addresses are assigned dynamically by AWS; when the infrastructure is provisioned again using the Terraform configuration, different IP addresses are likely to be assigned.
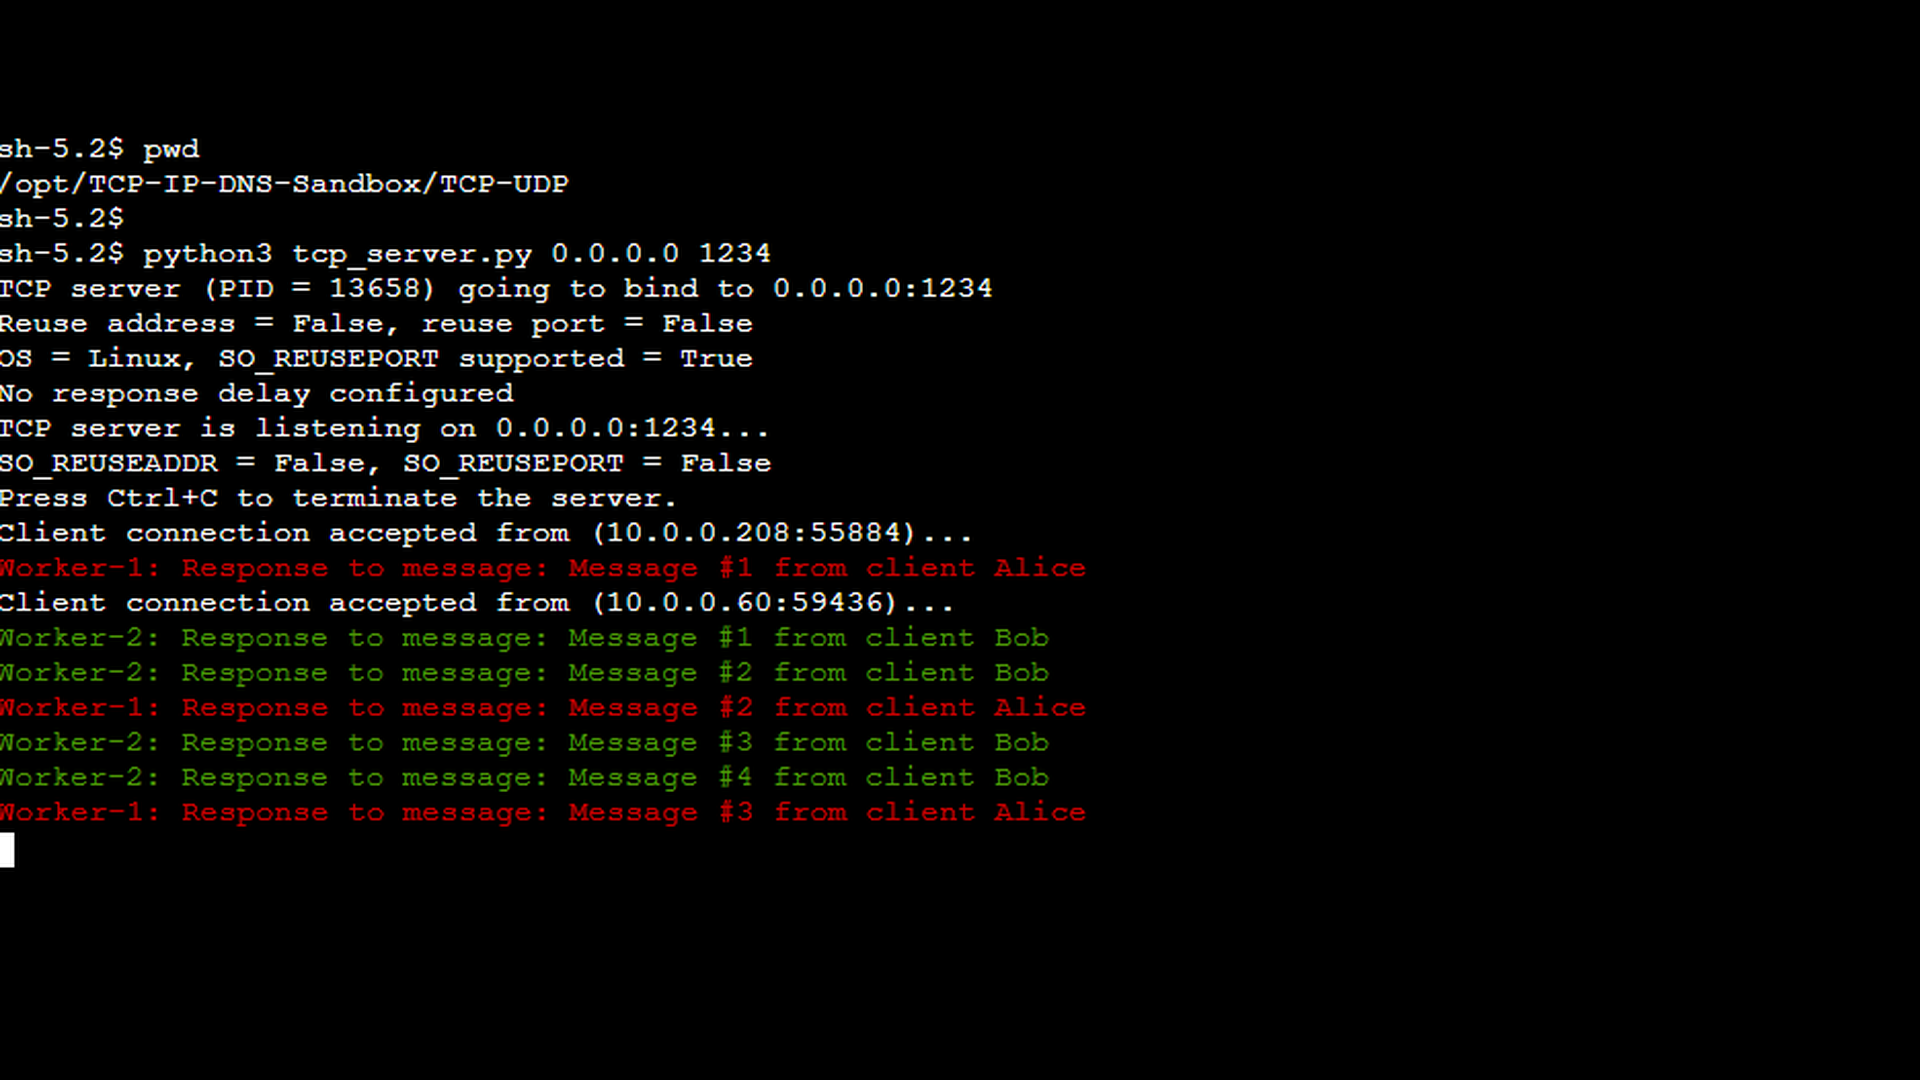
The following screenshots illustrate a normal server–client interaction before demonstrating the “connect timeout” error scenario. The first screenshot shows the TCP server running and accepting incoming client connections. For clarity, the server prints messages in different colors depending on which client the data comes from.
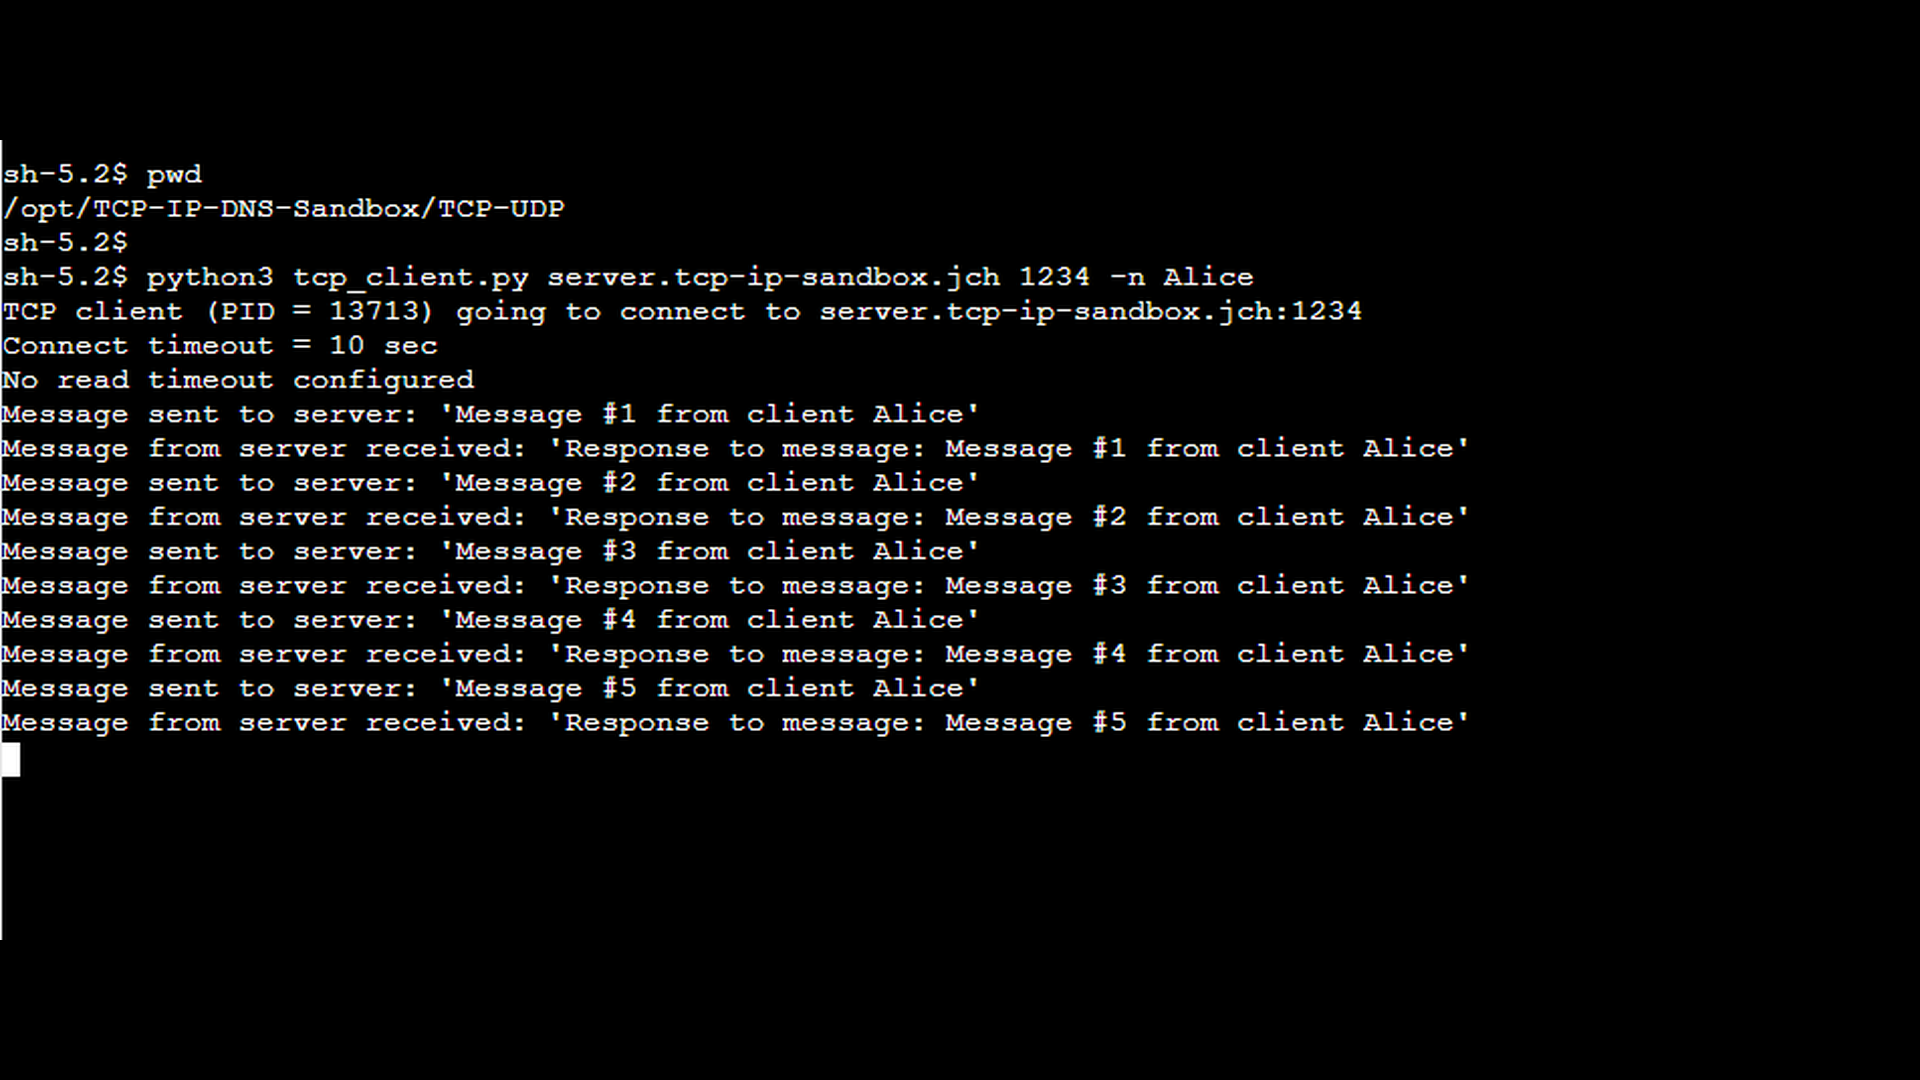
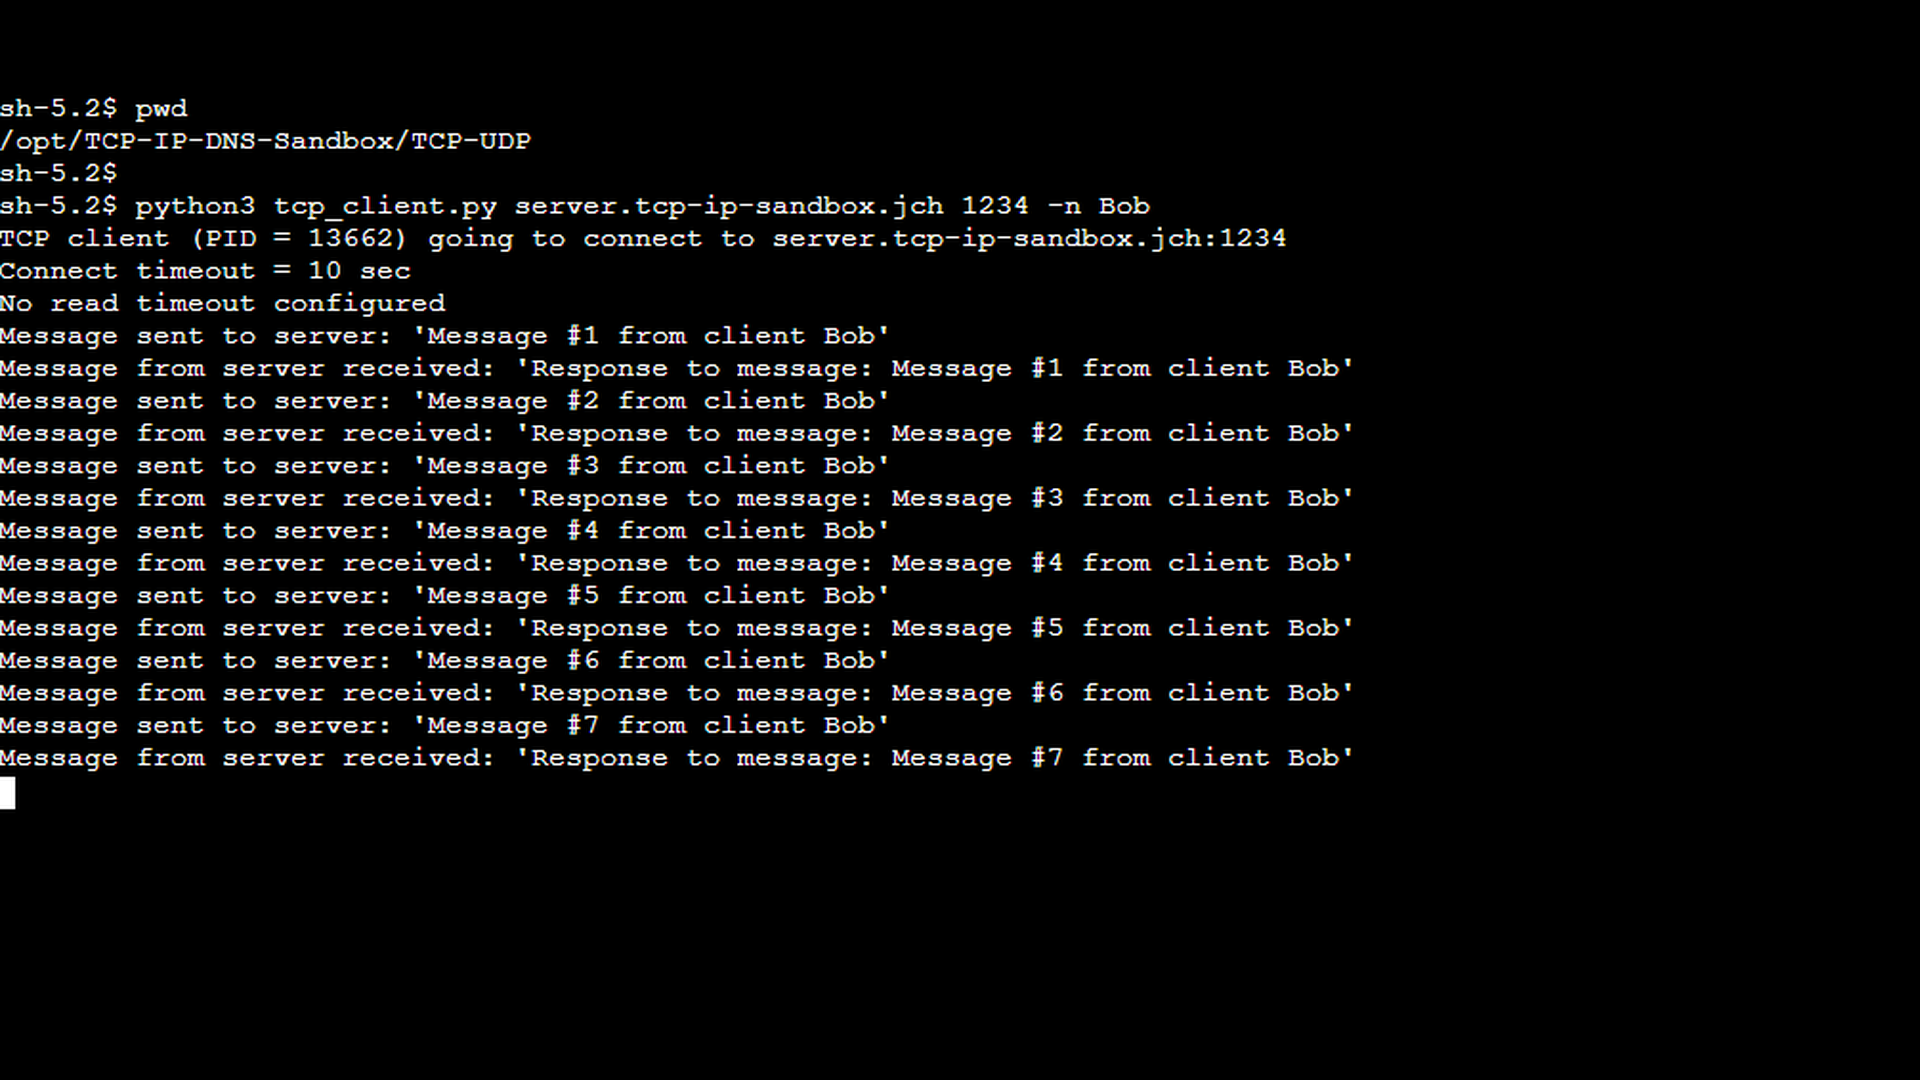
The next two screenshots show two separate clients successfully connecting to the server. Each client was started using the -n option, which allows assigning a custom client name. These names are included in the messages sent to the server and are clearly visible in the server’s output, making it easy to distinguish which client is communicating at any given moment. As you will see later, these messages are also visible in captured TCP segments. Each client was started on a different EC2 instance.
The established connections are also visible in the server’s ss output (see the screenshot below). The first part of this series demonstrated how to use the netstat tool, which is available on both Windows and Linux. On modern Linux systems, however, netstat is gradually being replaced by the ss tool. In this part, we will use ss instead, so readers can become familiar with both tools and understand how they provide equivalent information.
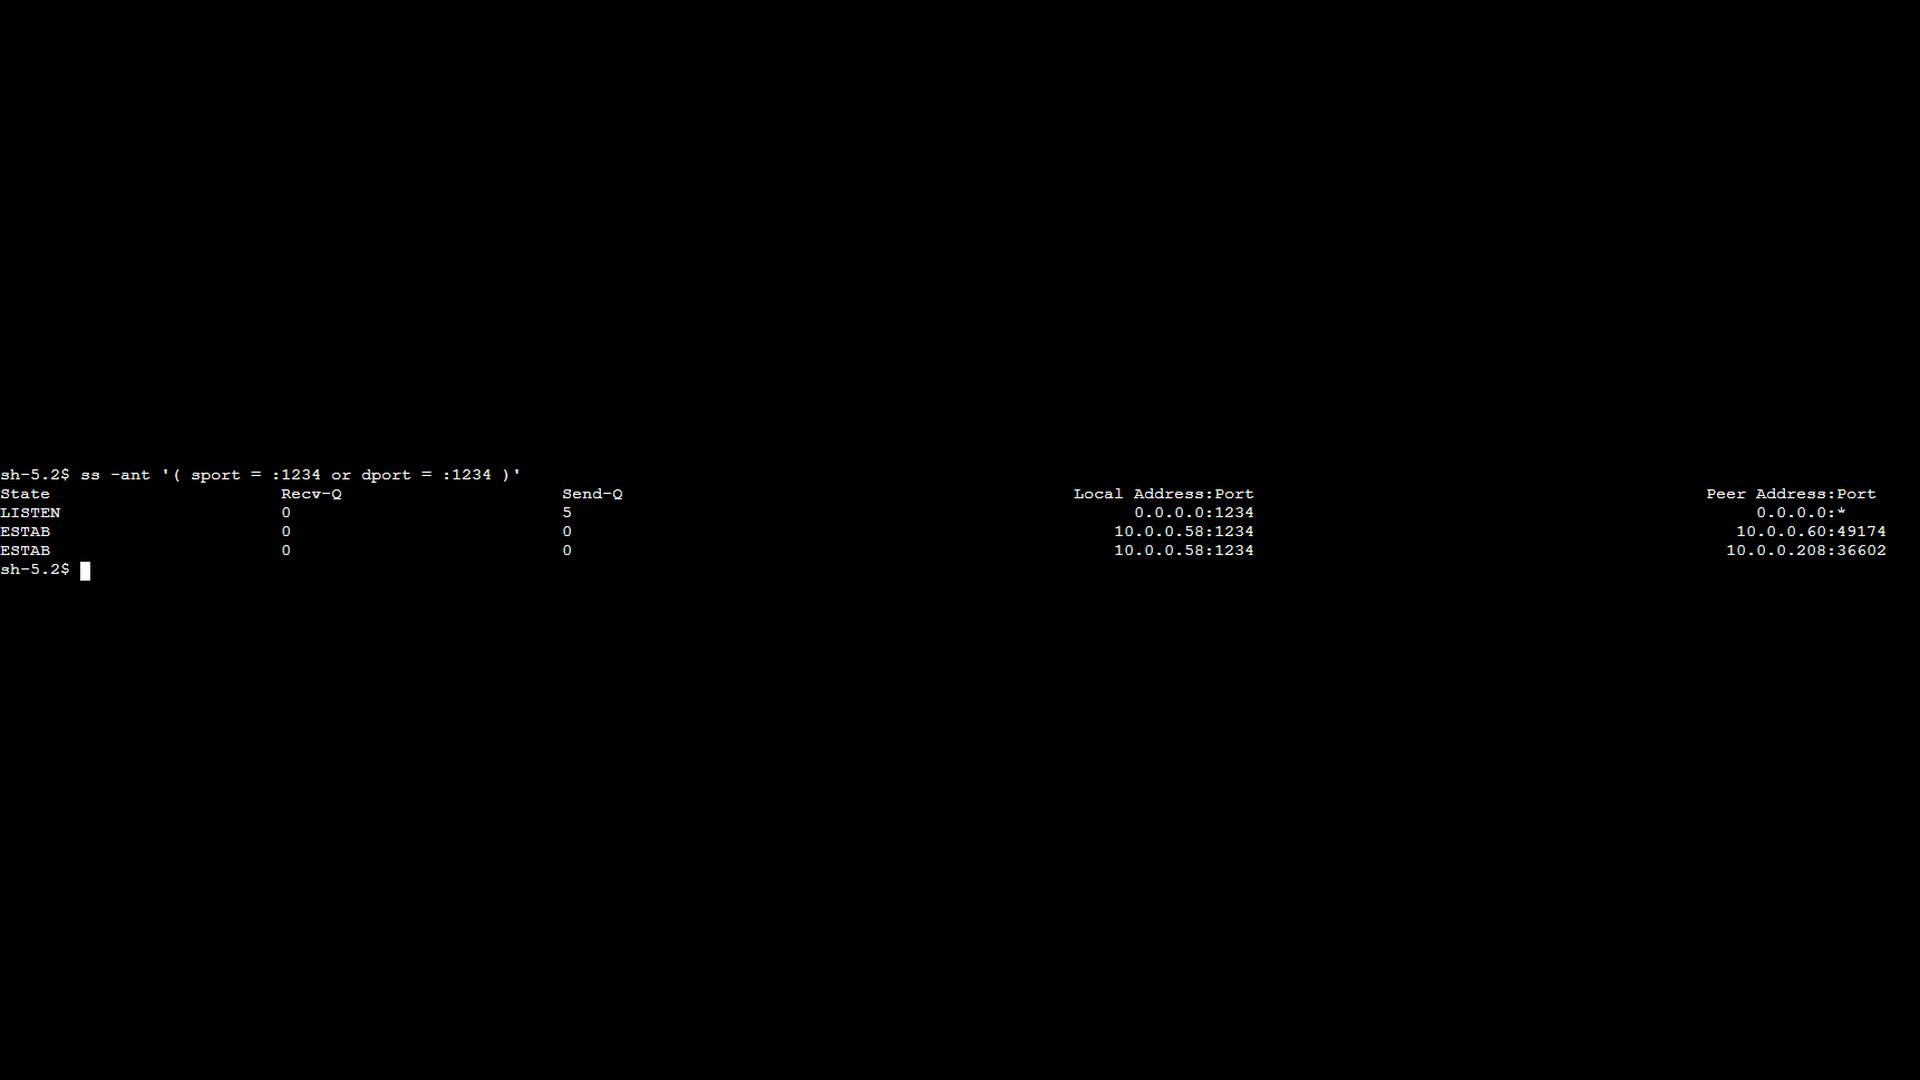
The ss command displayed by the screenshot above uses the following options:
- -a → all sockets (covers both listening and established), the same meaning as for netstat
- -n → forces numeric addresses and ports, the same meaning as for netstat
- -t → TCP sockets only
- ‘( sport = :1234 or dport = :1234 )’ → limits the output to sockets with source or destination port 1234
As you can see, the ss command provides information similar to that produced by netstat. Although the columns are arranged differently, the output still shows the socket state along with the local and remote endpoints. For sockets in the LISTEN state, no remote endpoint is displayed – a behavior that is identical to netstat.
The following screenshot illustrates how to capture the TCP traffic using tcpdump. The network capture can be running on the client host or on the server host. When troubleshooting practical problems, it might even make sense to capture the traffic on both sides and confront the two captures. Chances are there will be some discrepancies in the form of packets present on one side and missing on the other side. The nature of the discrepancies can give you a clue about the root cause of the problem. In this case, the TCP traffic will be captured on both sides. The following screenshot illustrates the client side. On the server side, the same command is used, but with a different filename.
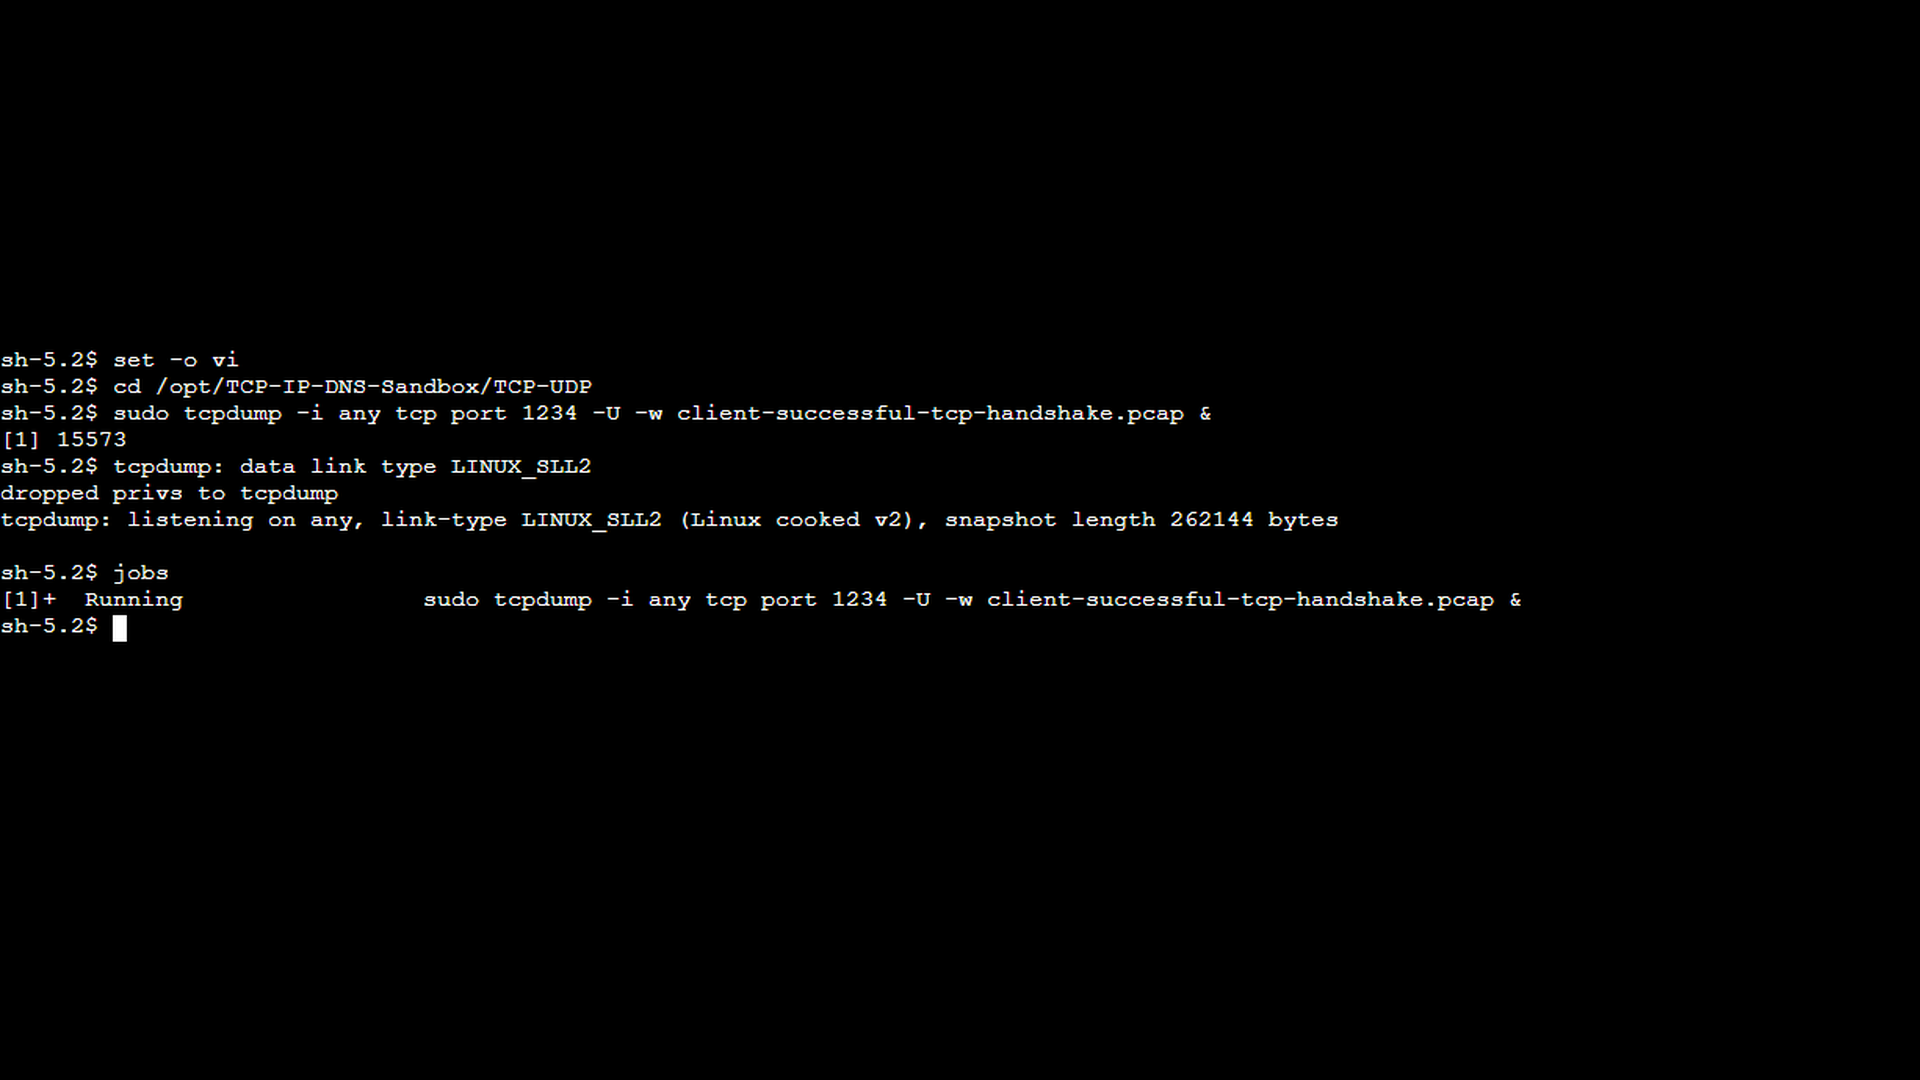
The tcpdump command displayed by the screenshot above uses the following options:
- -i any → instructs tcpdump to capture traffic on all network interfaces
- tcp port 1234 → filters only TCP traffic where the source or destination port is 1234
- -w tcp-port-1234.pcap → writes the captured packets to the given file for later analysis (e.g., in Wireshark)
- -U → instructs tcpdump flush the captured packets immediately to the output file (no buffering)
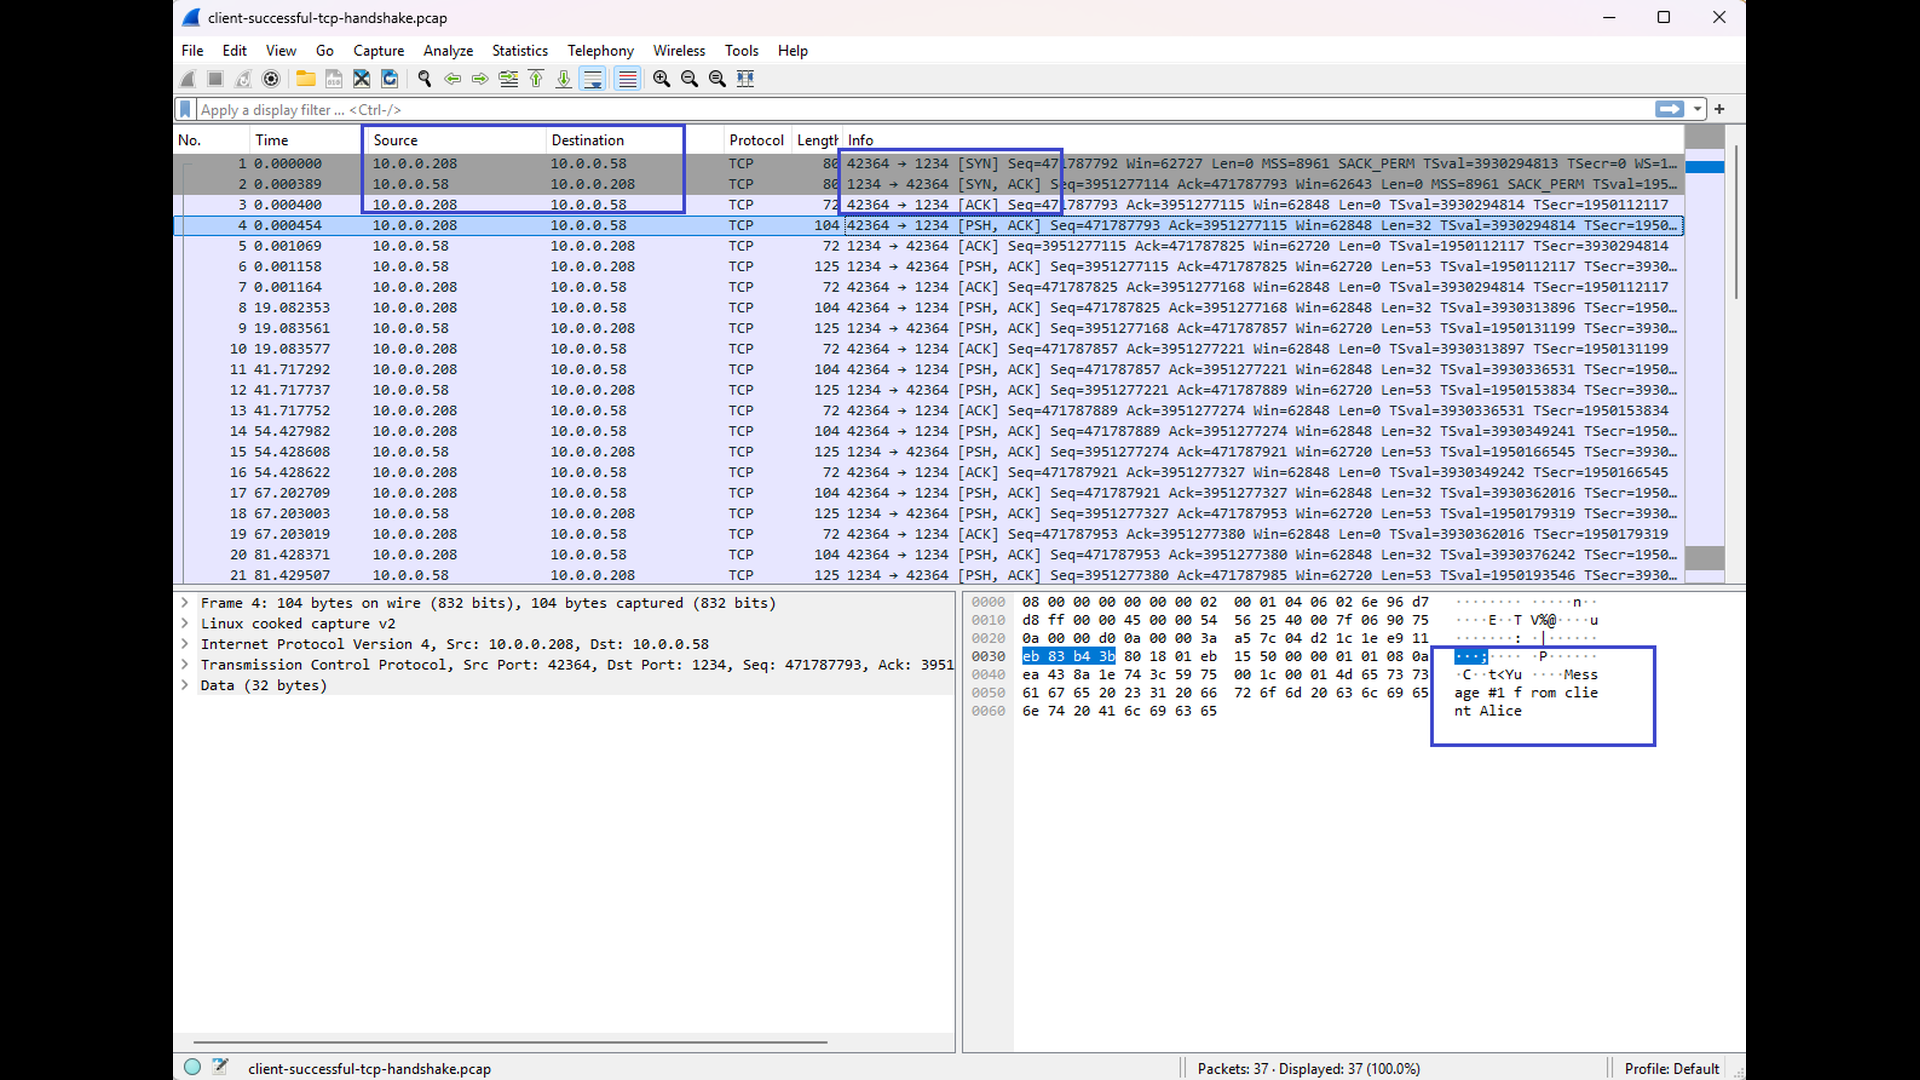
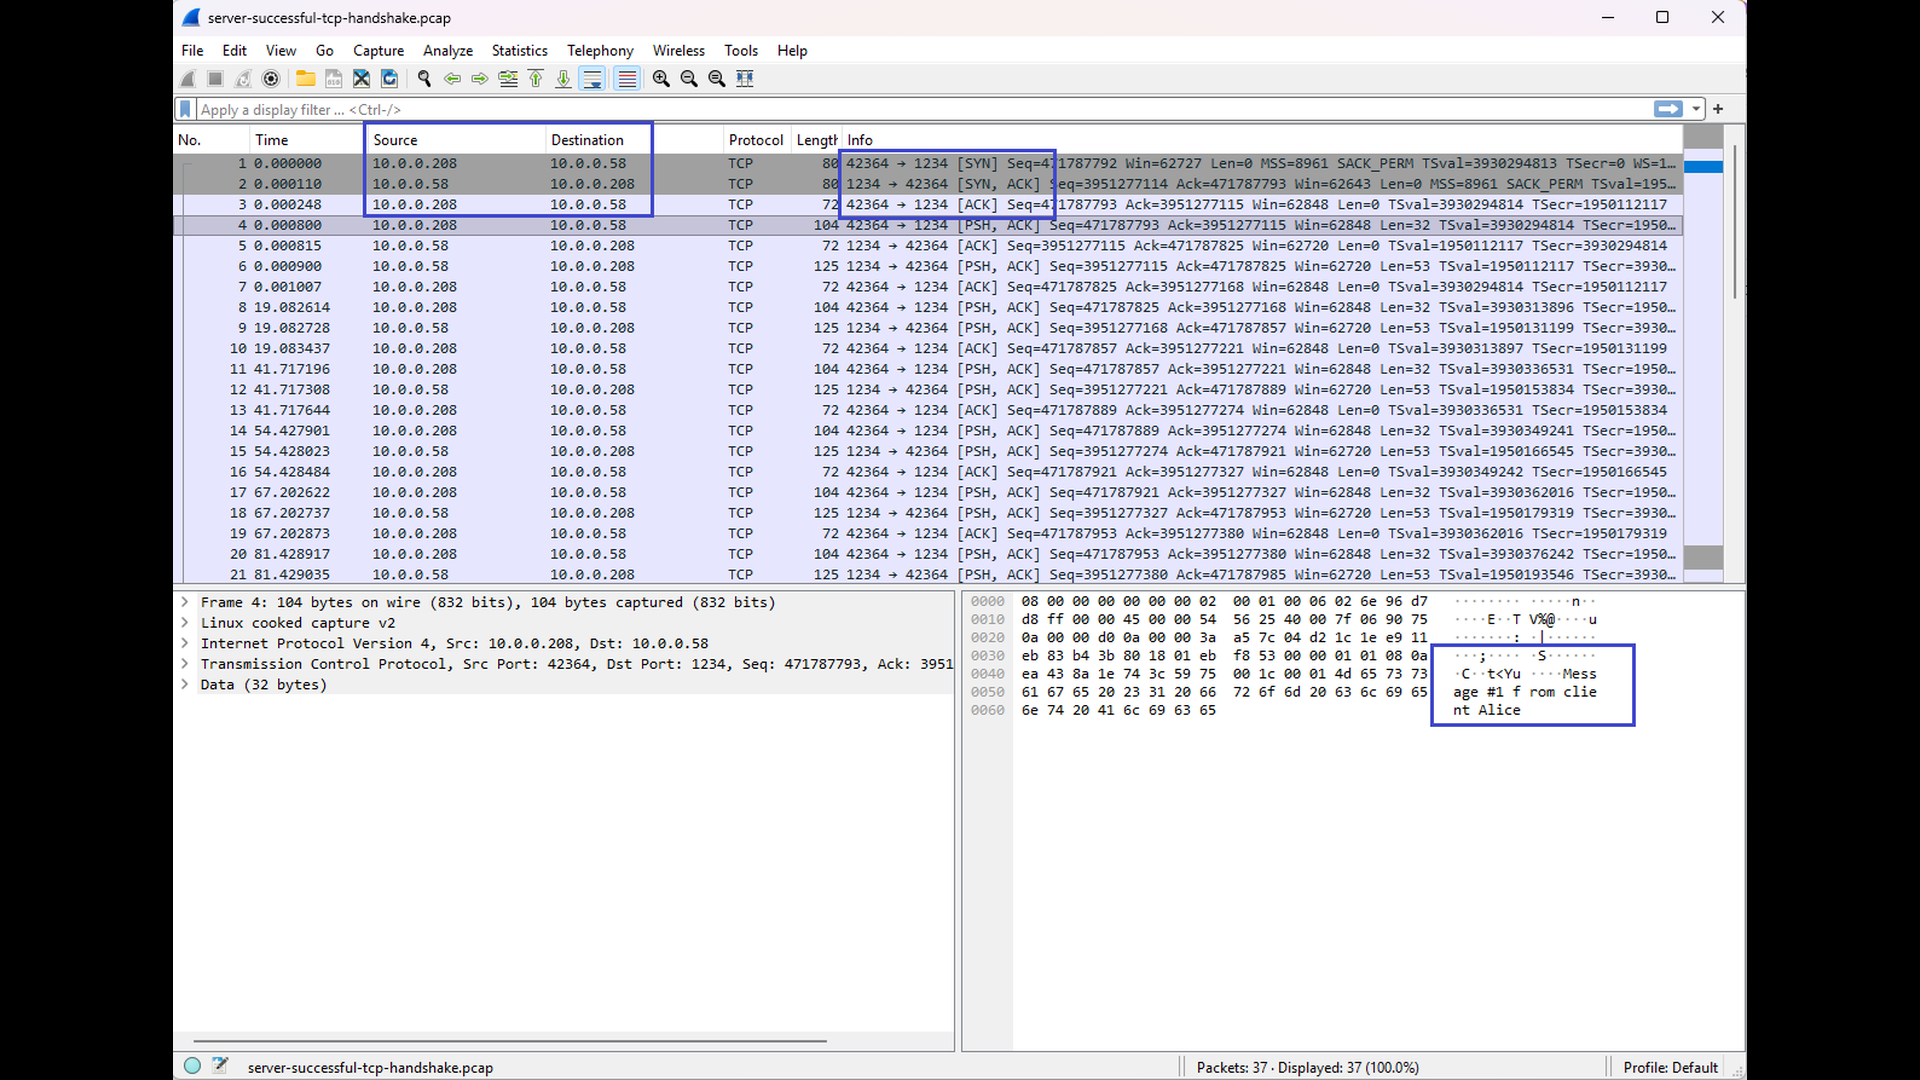
The following pair of screenshots shows the network capture opened in Wireshark. The first screenshot presents the client-side capture, while the second shows the server-side capture. Both captures contain the same TCP segments, confirming that there is no discrepancy between what the client sends and what the server receives.
- A successful TCP three-way handshake is visible, consisting of the SYN, SYN + ACK, and ACK sequence. The TCP connection to port 1234 on host 10.0.0.58 (the server EC2 instance) is initiated from host 10.0.0.208 (the client #1 EC2 instance). An ephemeral port 42364 is automatically chosen on the client side.
- After the handshake completes, the application-level message exchange follows. As highlighted in the screenshot, the fourth packet carries the message “Message #1 from client Alice”, which is sent from the client to the server and encapsulated in the TCP payload.
In the following scenario, we demonstrate a failed connection attempt that results in a connect timeout. As the TCP server has not been terminated after the previous scenario, there is no need to start it. For this test, the client attempts to connect to TCP port 1235, which is intentionally blocked by the security groups (see the infrastructure diagram above).
Before starting the client, network capture is initiated on both the client and the server, using the same tcpdump options described earlier. However, TCP port 1235 must be used in this case. Capturing traffic on both sides allows us to confirm not only what the client sends, but also what the server does not receive.
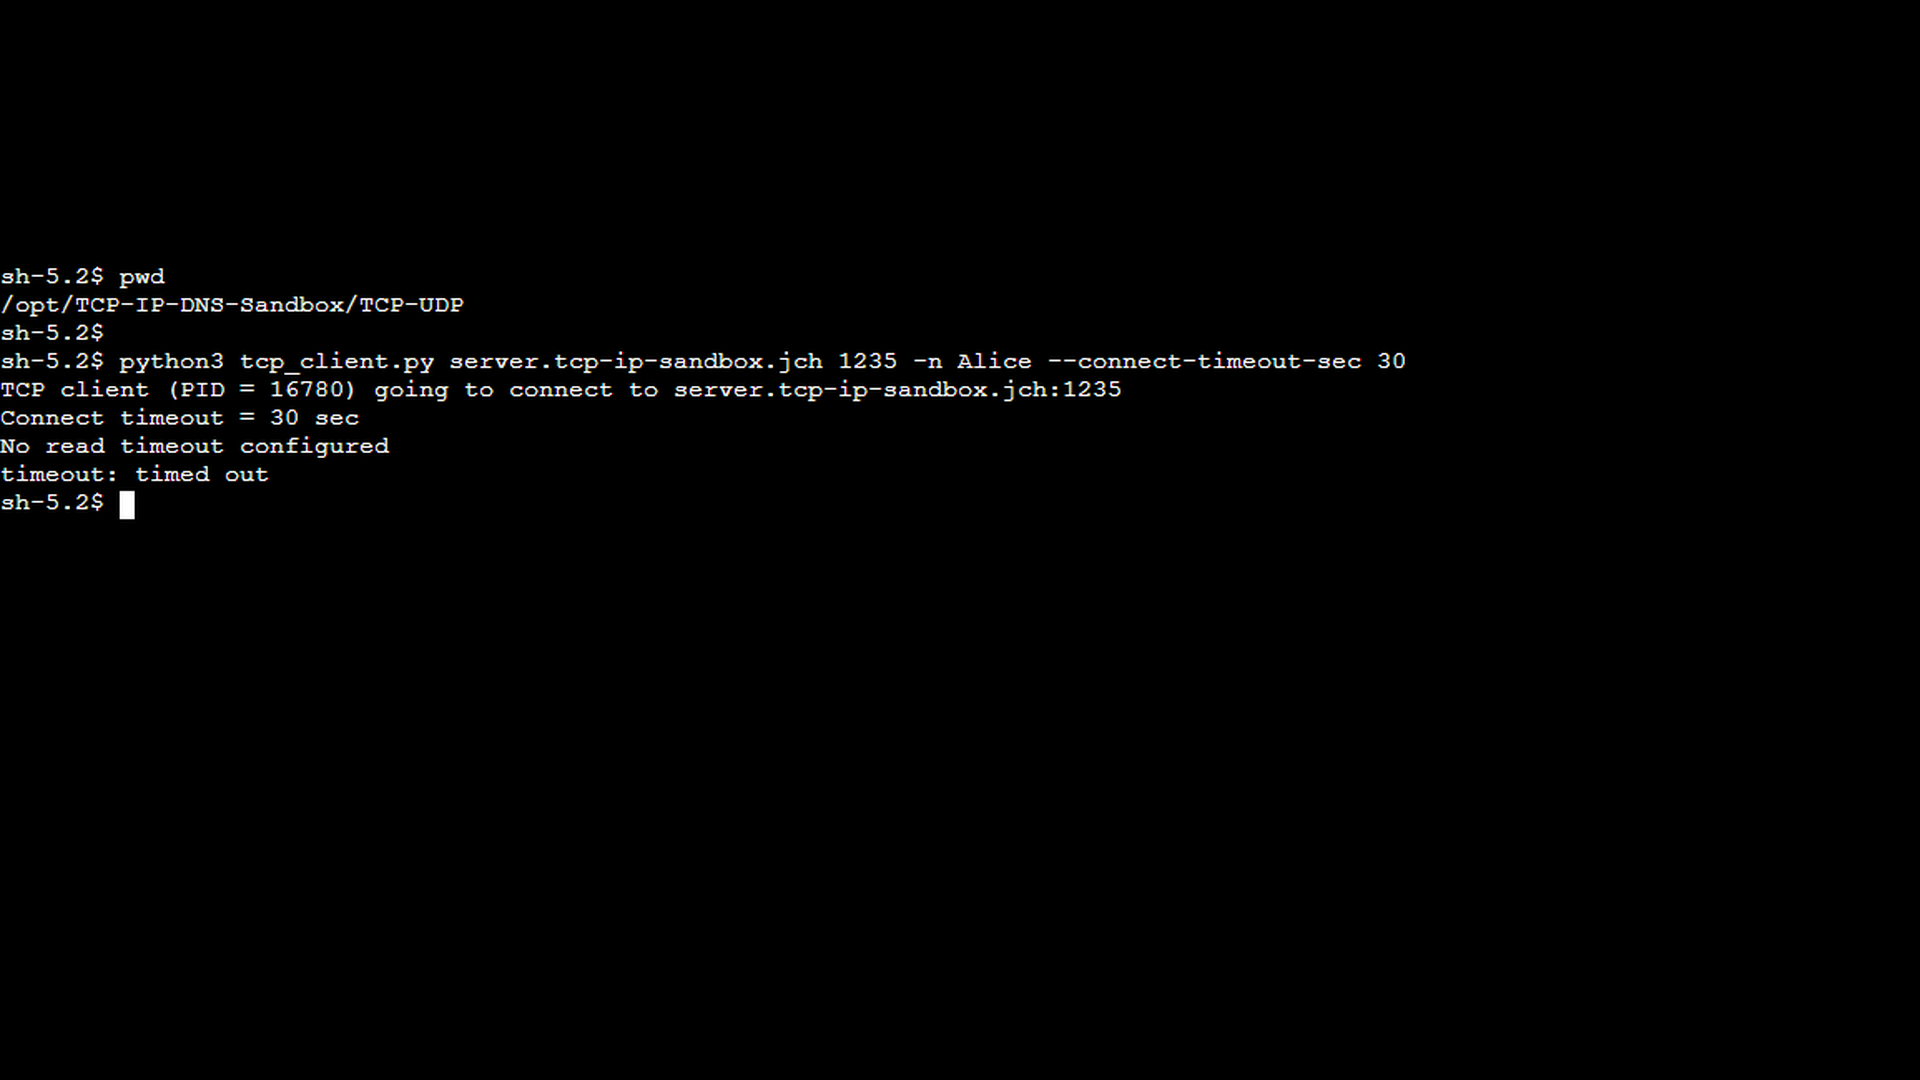
The following screenshot shows the client failing to connect to the port 1235. The –connect-timeout-sec option sets the connection timeout to 30 seconds. This relatively long timeout allows us to observe multiple retransmissions of the SYN segments during the connection attempt.
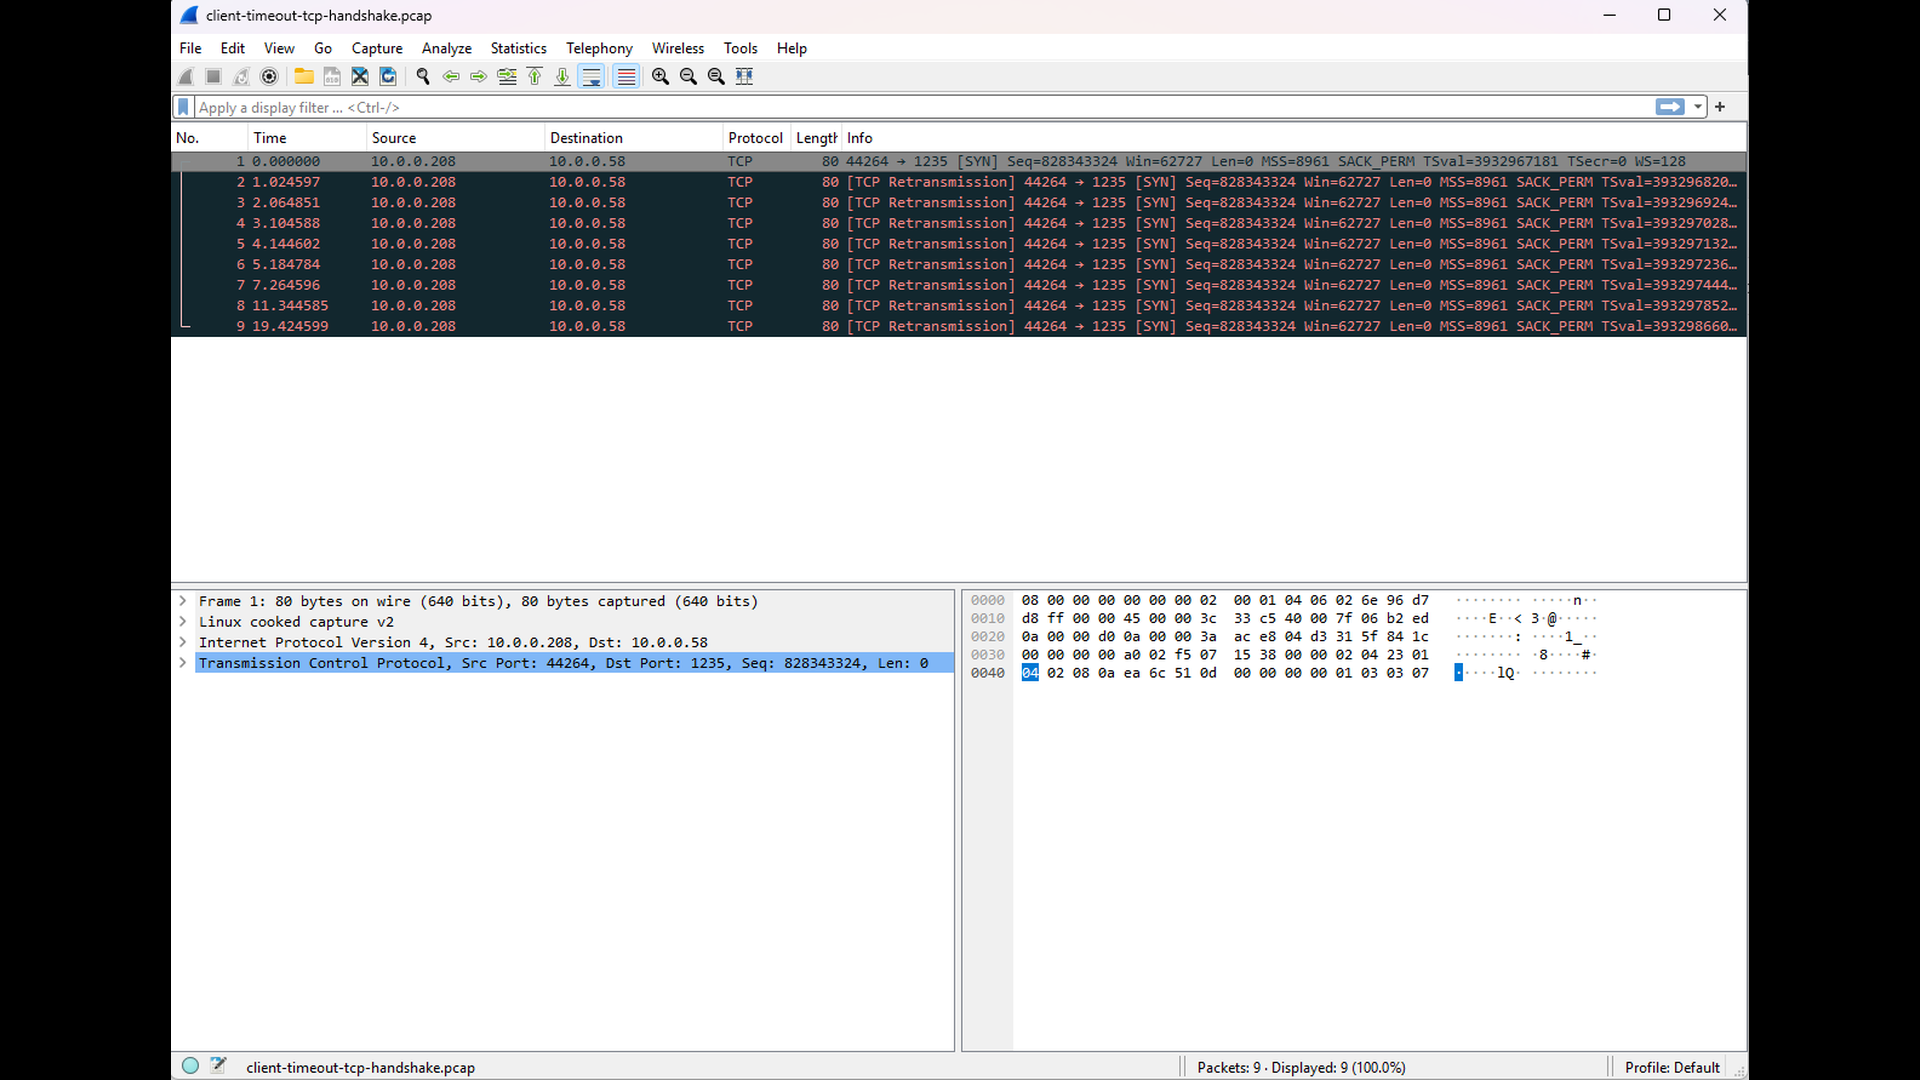
The following Wireshark screenshots illustrate what a connect timeout looks like on the wire. In the client-side capture, you can see the initial SYN segment sent by the client toward the server. Because the destination port is blocked, the client never receives a SYN + ACK (nor a RST) in response. As a result, the TCP stack retransmits the SYN segment multiple times before the connection attempt eventually times out. The repeated SYN retransmissions are clearly marked, making it easy to recognize the characteristic pattern of a connect timeout. As you will also see in future parts of the series, Wireshark automatically highlights packets that indicate potential issues.
The corresponding capture taken on the server side is empty (see the screenshot below). This confirms that the SYN segments never reach the server host and are being dropped by network filtering – in this case, the security group configuration. The absence of packets on the server side is a strong indication that the problem lies in the network path rather than in the server application itself.
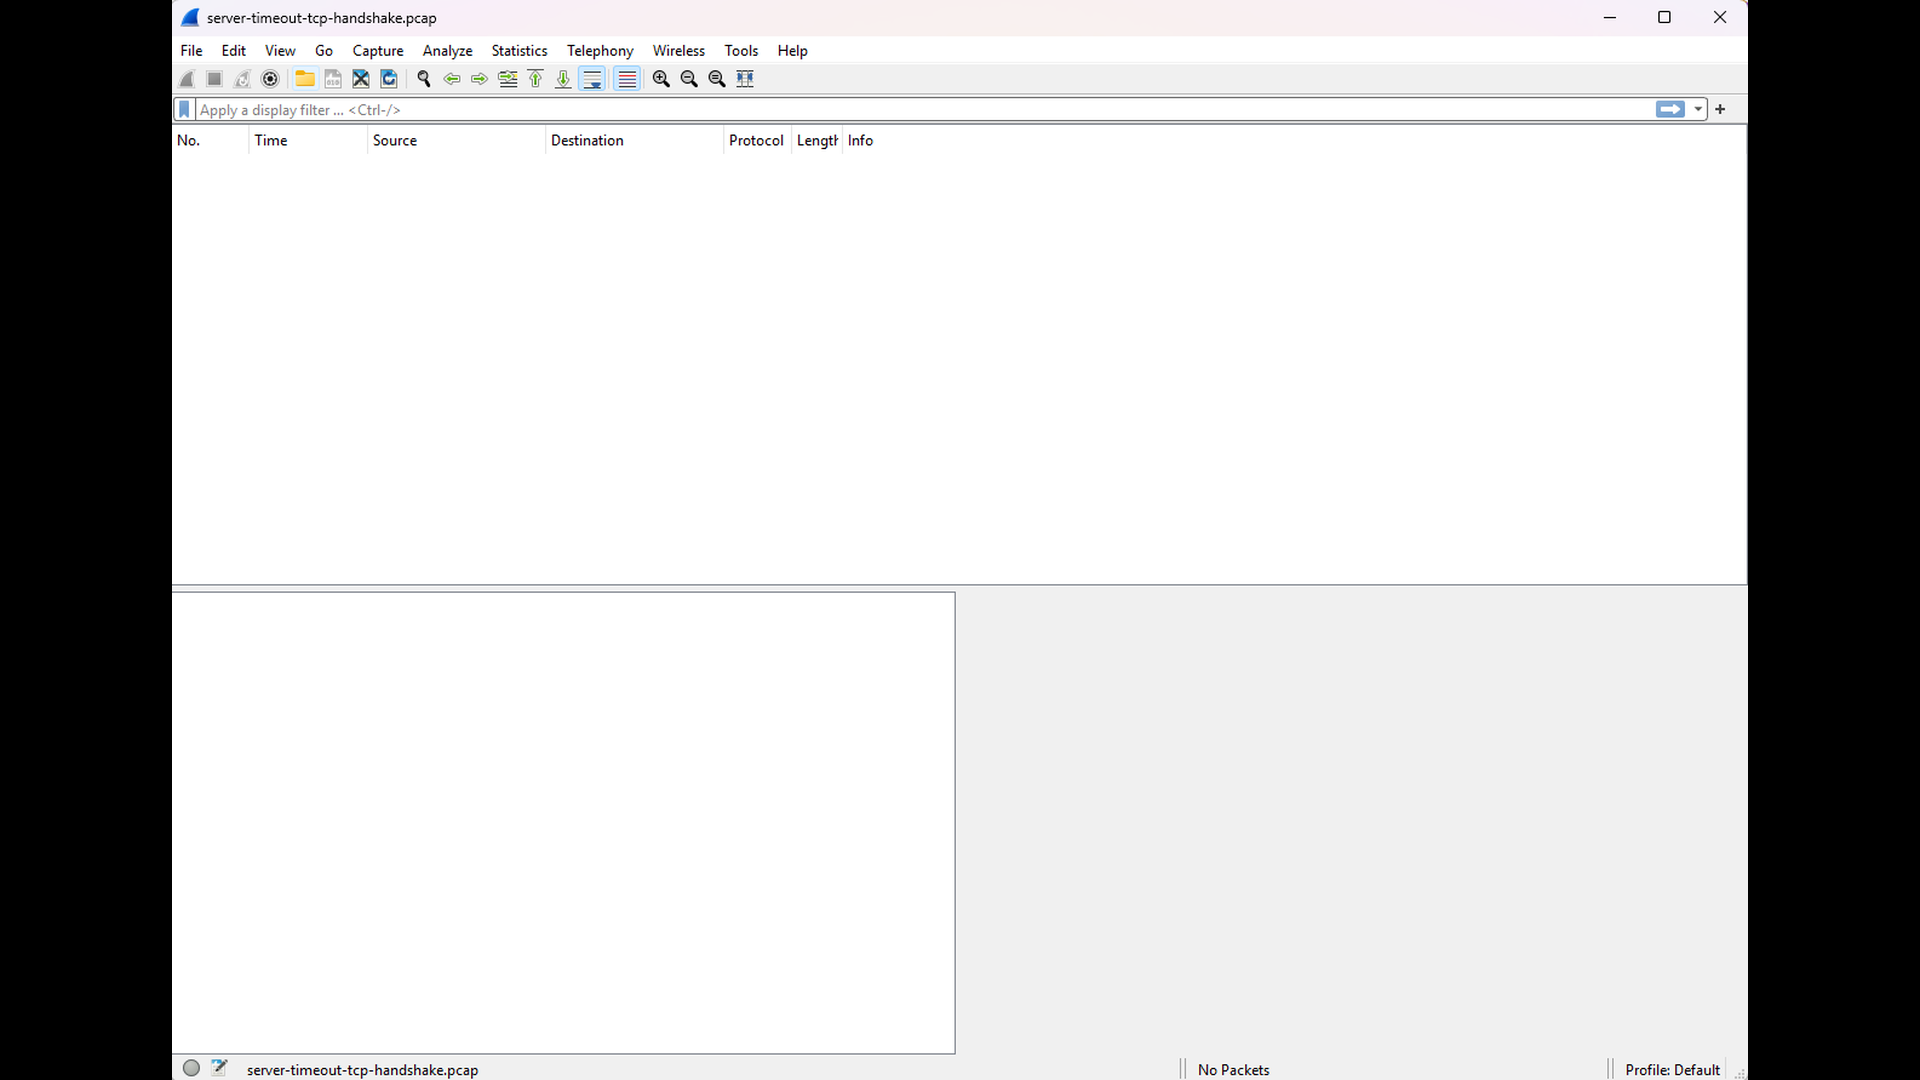
It is worth noting that the -U option was used when starting tcpdump for these captures. This option disables output buffering and forces packets to be written to the capture file immediately. Without -U, short-lived events such as failed connection attempts may result in an apparently empty capture file, even though some packets were actually captured.
After examining the packet captures, it is useful to verify the behavior from a more application-oriented perspective. The nc (netcat) tool provides a simple and effective way to test TCP connectivity without writing any custom code. The following screenshot shows two invocations of nc. In the first case, nc successfully connects to TCP port 1234, where the server is listening and the traffic is allowed. The connection is established immediately, confirming that the service is reachable and the network path is open. In the second case, nc attempts to connect to the same host on TCP port 1235, which is blocked by the security groups. As expected, the connection attempt does not receive any response and eventually fails with a timeout. This behavior matches what we observed earlier in the packet captures: SYN packets are sent, but no reply is received.
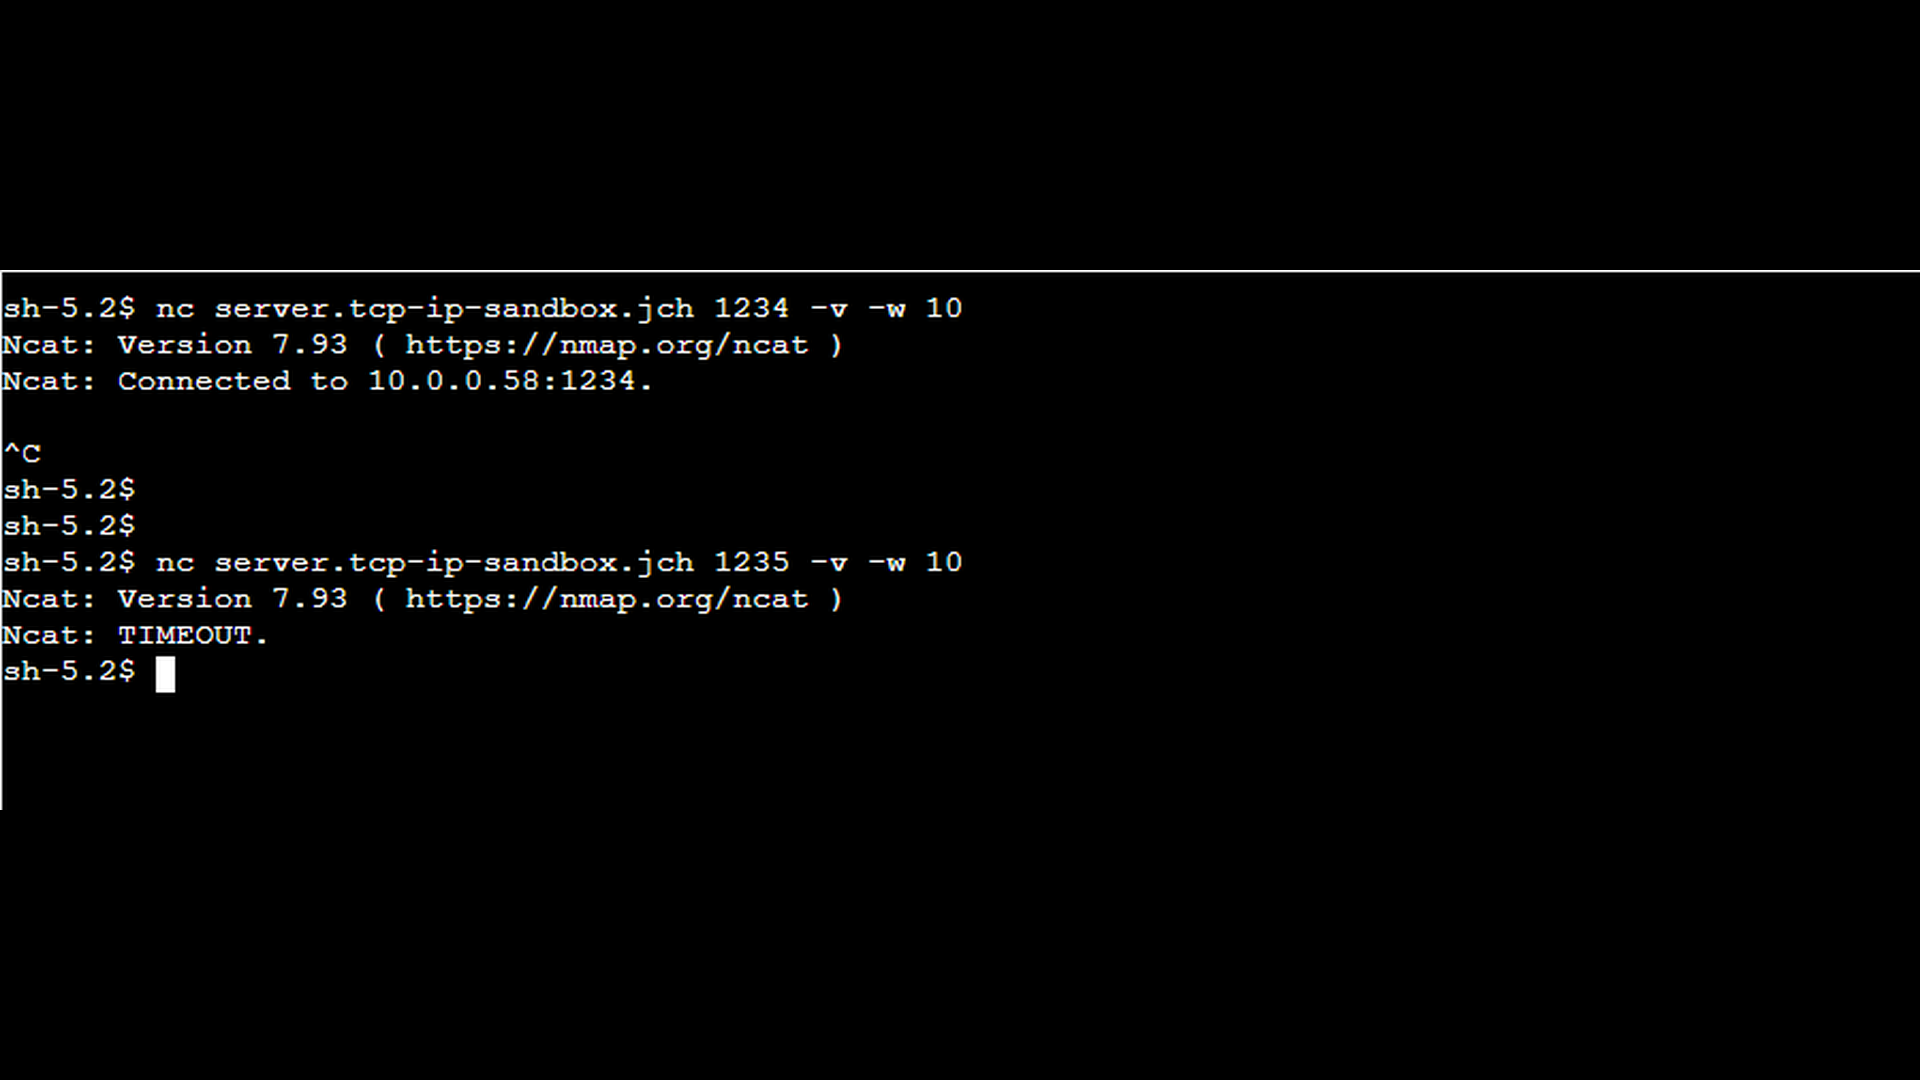
This example has shown how nc can be used as a quick, lightweight alternative to full packet capture when troubleshooting connectivity issues. While nc is typically available on Linux systems, Windows users can rely on the Test-NetConnection PowerShell cmdlet, which provides equivalent functionality.
The nc command displayed by the screenshot above uses the following options:
- -v → verbose
- -w → connect timeout in seconds
Finally, it is worth mentioning the ping command, which is often the first tool used when diagnosing connectivity problems. A successful ping confirms that the destination host and its network interface are reachable at the IP level and that basic routing is in place. However, ping uses the ICMP protocol and does not test the availability of TCP or UDP ports. As a result, a host may respond to ping while TCP connection attempts still fail due to firewalls, security groups, or port-specific filtering – as demonstrated earlier in this section. The following screenshot shows a successful ping despite the failed attempt to connect to the TCP port 1235.
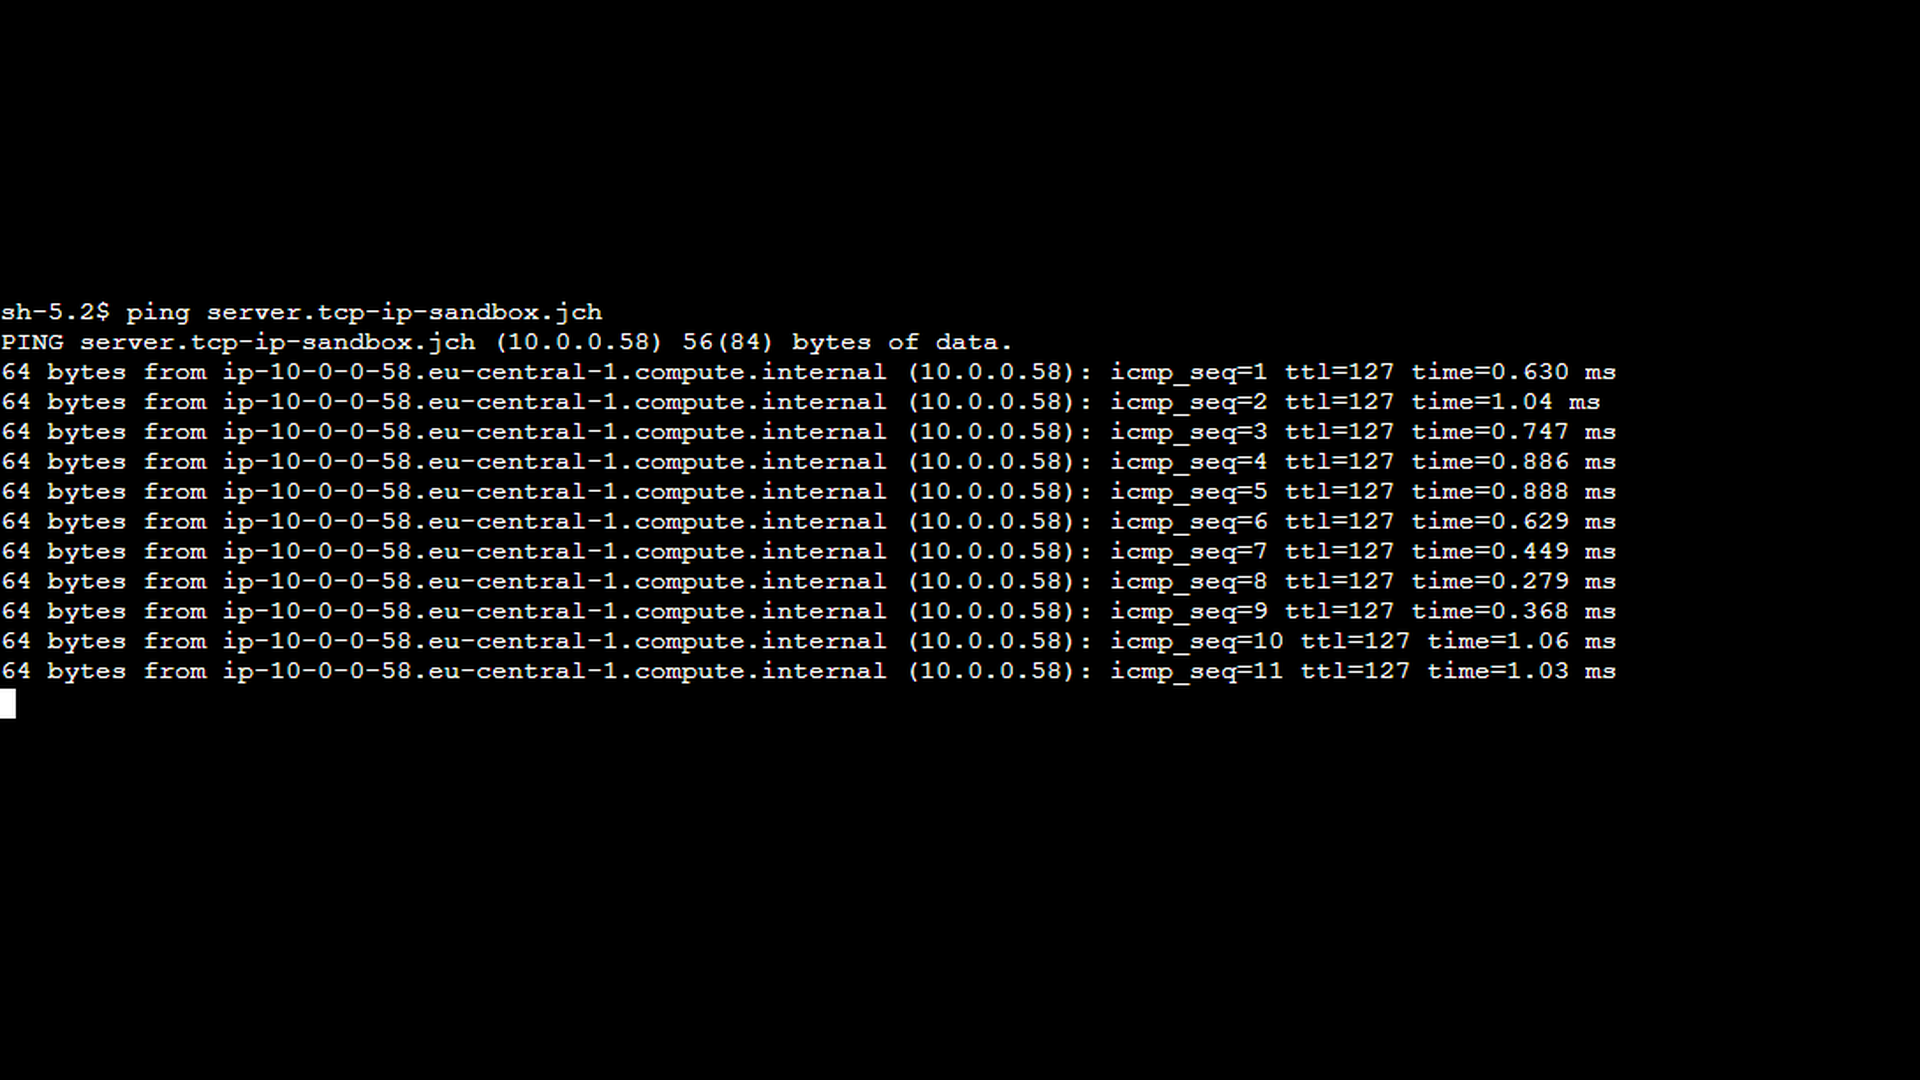
It is also worth noting that the Test-NetConnection PowerShell cmdlet mentioned earlier includes ICMP (ping) reachability checks in addition to the TCP connectivity test.
Conclusion
A “connect timeout” error indicates that the client’s SYN packets never receive a response – not a SYN + ACK and not a RST. This silent failure typically points to packet filtering, missing routes, or a firewall that drops traffic without sending any feedback. By understanding how the TCP handshake works and how retransmissions behave when no replies are received, you can quickly distinguish a timeout from other connection failures.
Practical tools such as ping, nc, tcpdump, and Wireshark help you determine whether the destination is reachable, where packets may be disappearing, and whether the issue lies in routing, firewall configuration, or network infrastructure. The packet captures in this part demonstrated what a timeout looks like on the wire: repeated SYN packets leaving the host with no responses coming back.
In the next part of this series, we shift from no response at all to an explicit refusal. Part 3 focuses on the “connection refused” error – a scenario where the SYN packet does reach the destination, but the operating system replies with a RST because no process is listening on the target port. Understanding the distinction between timeout and refusal is essential for accurate troubleshooting of TCP connection problems.

