
Introduction
In the previous parts of this series, we focused on errors that occur during connection setup (“address already in use,” “connect timeout,” “connection refused”) and during established connections that are aborted abruptly (“connection reset by peer”). In this fifth part, we move to a different category of issues: errors that arise not from connection failures, but from unexpected delays in data transfer.
A “read timeout” error occurs when one side of a TCP connection initiates a read operation and no data arrives within the configured timeout period. This does not mean the connection is broken at the TCP level – the underlying connection may still be fully established and healthy. Instead, a read timeout typically reflects an application-level or system-level delay: the remote endpoint is not sending data quickly enough, is busy processing a request, is blocked on a dependency, or is otherwise not ready to respond.
To understand this behavior, it is useful to look at how TCP handles full-duplex data flow, buffering, and the exchange of application messages. Many TCP-based protocols – such as classic HTTP – follow a request/response pattern where the client expects a timely reply. When that reply is delayed beyond the read timeout, the receiving application aborts the operation even though the TCP connection remains established unless the application explicitly closes or aborts it after the timeout.
As in earlier parts, this chapter is structured into three subsections:
- TCP Insights – explains how TCP delivers data, how applications interact with receive buffers, and why delays may occur even on an otherwise healthy connection.
- Error Behavior – illustrates what happens when the expected data does not arrive in time and how a read timeout manifests at the application level.
- Troubleshooting – provides practical steps for identifying whether a timeout is caused by network issues, slow processing on the remote side, resource contention, or downstream dependency bottlenecks.
The demonstrations once again use the TCP/IP & DNS Sandbox Git repository to show real read-timeout scenarios, packet captures, and application behavior under load or delay. Understanding read timeouts is essential for diagnosing slow services, blocked processing pipelines, and unexpected latency spikes in distributed systems.
TCP Insights
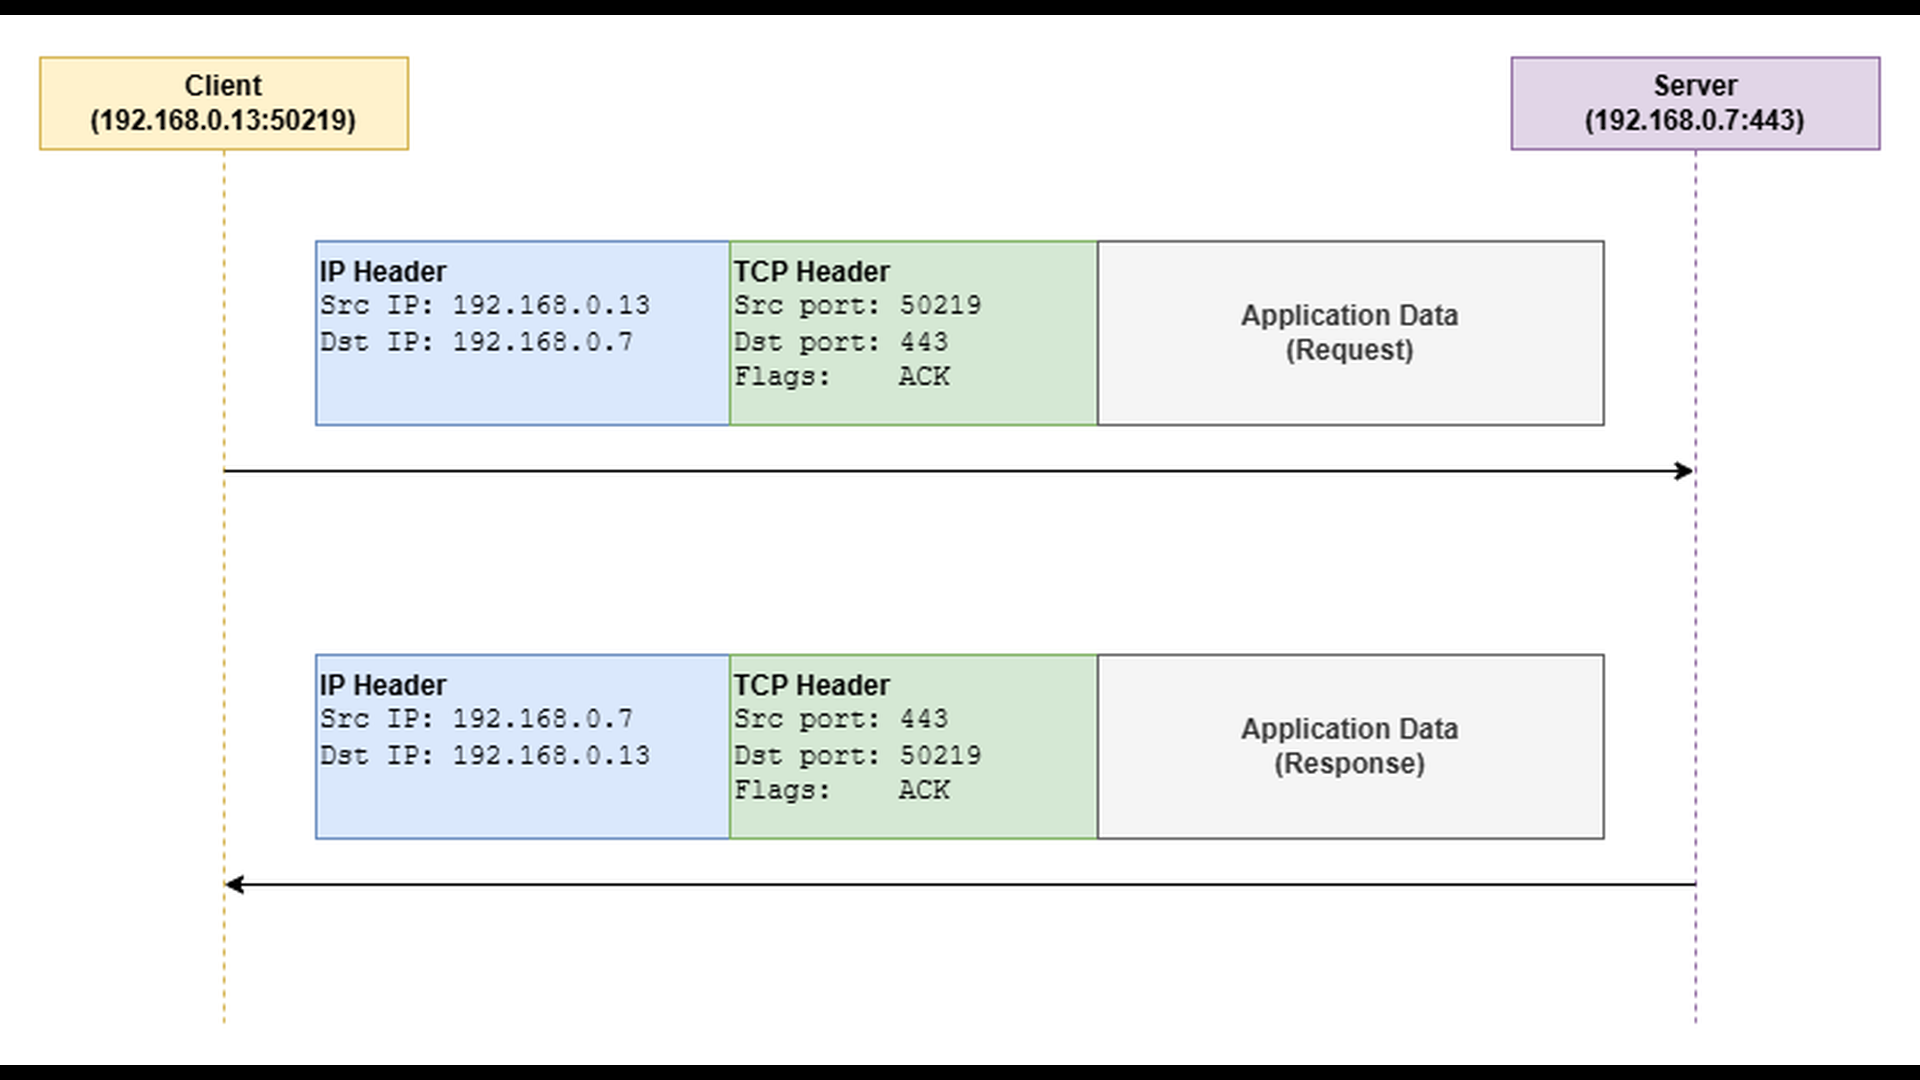
Many application protocols that use TCP as their transport layer follow a request–response communication pattern. In this model, the client sends a request message, waits for a corresponding response, and only then proceeds with the next operation.
The most familiar example of such a protocol is traditional HTTP without WebSockets or other persistent, bidirectional extensions. In a typical HTTP transaction, the client sends an HTTP request (for example, GET /index.html), and the server responds with an HTTP response containing status information and the requested data. At the transport level, both the request and the response are carried inside TCP segments, each encapsulated within an IP packet as outlined by the diagram below.
Error Behavior
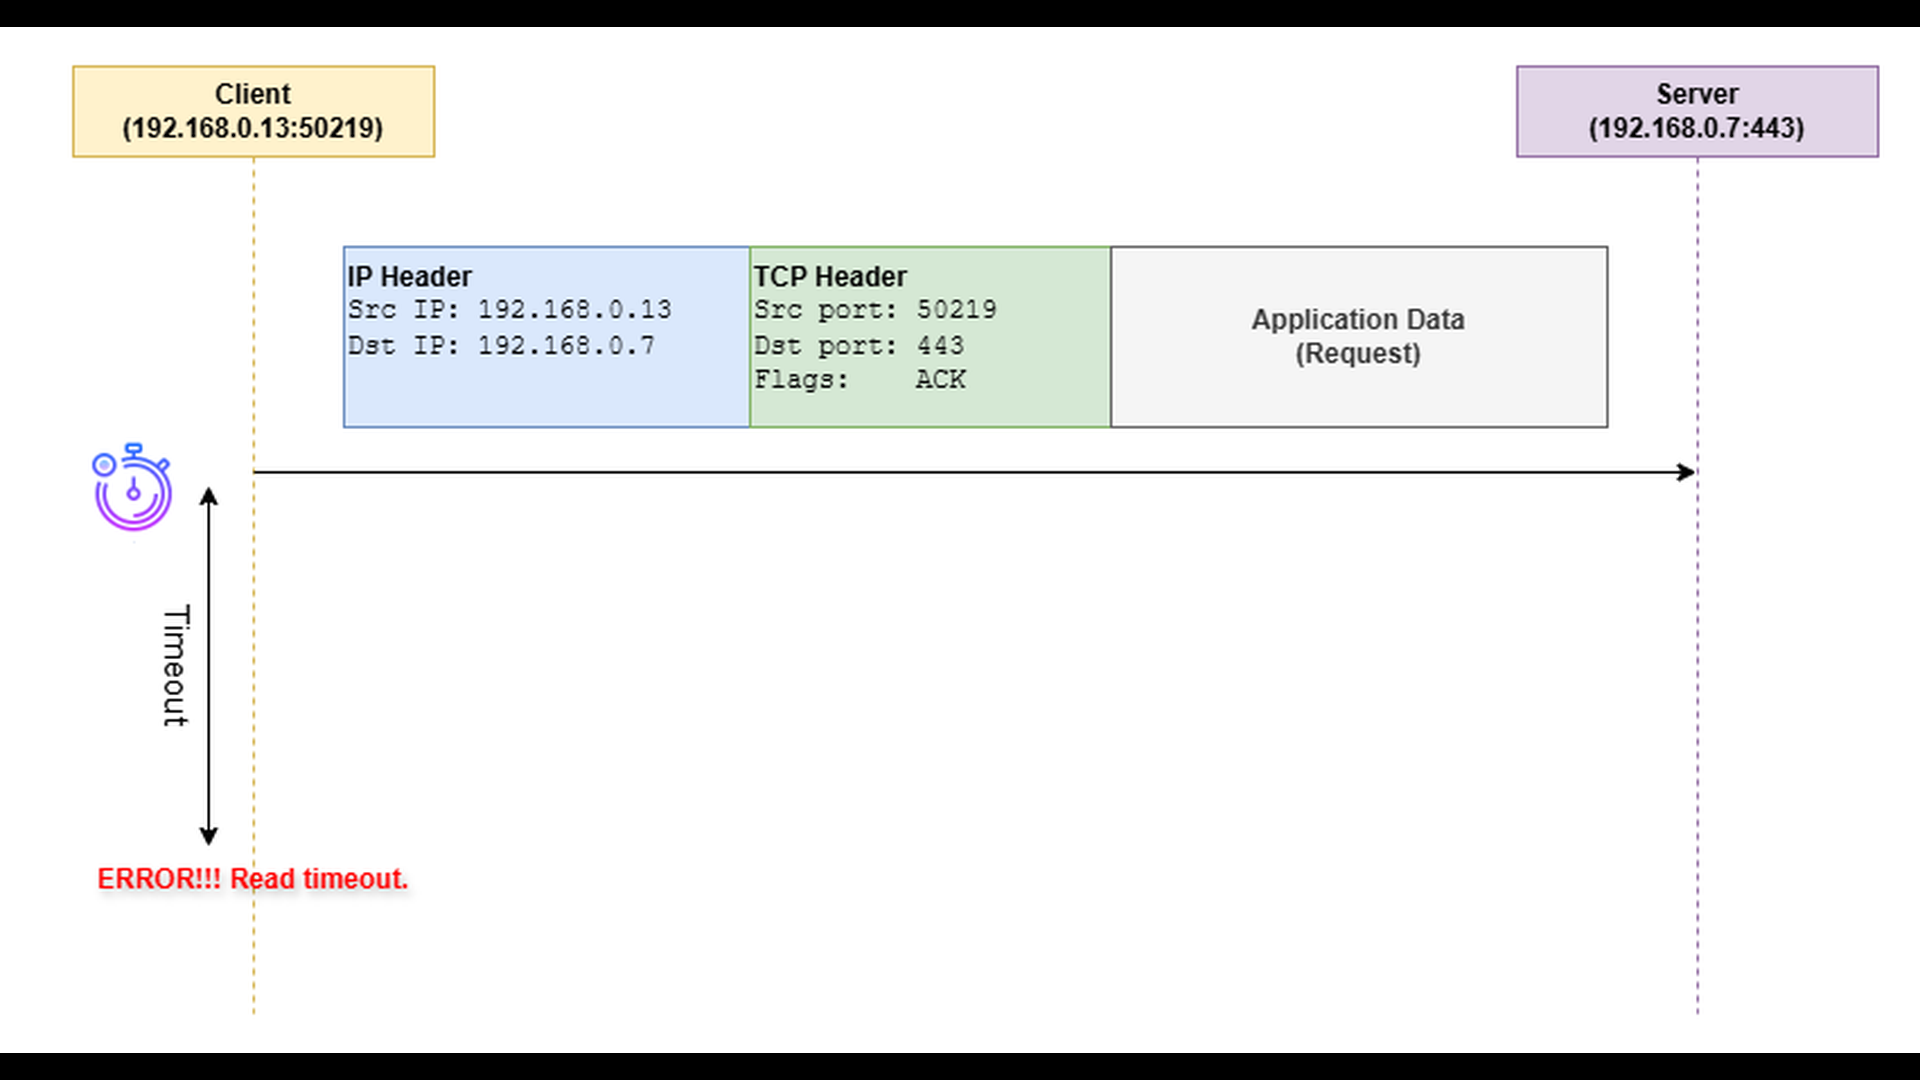
When an application sends a request to its communication counterpart and expects a quick response, it often performs the socket read operation with a configured read timeout. This timeout defines how long the application is willing to wait for incoming data before considering the operation failed.
If the client sends the request successfully but receives no response within the defined period, the read operation aborts and raises a “read timeout” error. The TCP connection itself usually remains open – no RST or FIN is exchanged – but the application decides that the waiting time has exceeded acceptable limits.
Troubleshooting
Troubleshooting “read timeout” errors can be challenging because the cause may lie either in the transport path (packet loss, congestion, retransmissions), or in an unresponsive application. The key diagnostic step is to determine whether the problem results from lost or delayed packets, or from the server simply not generating a response in time.
- Use packet capture tools such as tcpdump or Wireshark to examine the network traffic between the client and server. Capturing on both sides of the communication can be especially useful – by comparing the two captures, you can identify where packets are delayed or lost.
- Look for retransmissions or missing packets, which indicate packet loss or congestion. Missing acknowledgments or significant delays between sent packets and acknowledgments should also attract your attention.
- If the network captures show that the request reaches the server, but the response is delayed, the issue is likely on the application side. By analyzing timestamps in the server-side packet capture, you can measure how long the server takes to produce the first response bytes after receiving the request. A long delay points to application unresponsiveness.
- In case of application unresponsiveness, monitor the resource consumption (CPU, memory) on the server.
- There can be dependency bottlenecks – the application might be waiting on a database, external API, or another service.
- There can be resource contention within the application, for instance too many threads competing for the same lock.
To illustrate how the “read timeout” error occurs in practice, we will use the TCP server and TCP client applications from the TCP/IP & DNS Sandbox repository. The demo runs on the AWS infrastructure provisioned by the accompanying Terraform configuration, but the applications behave the same way in any environment.
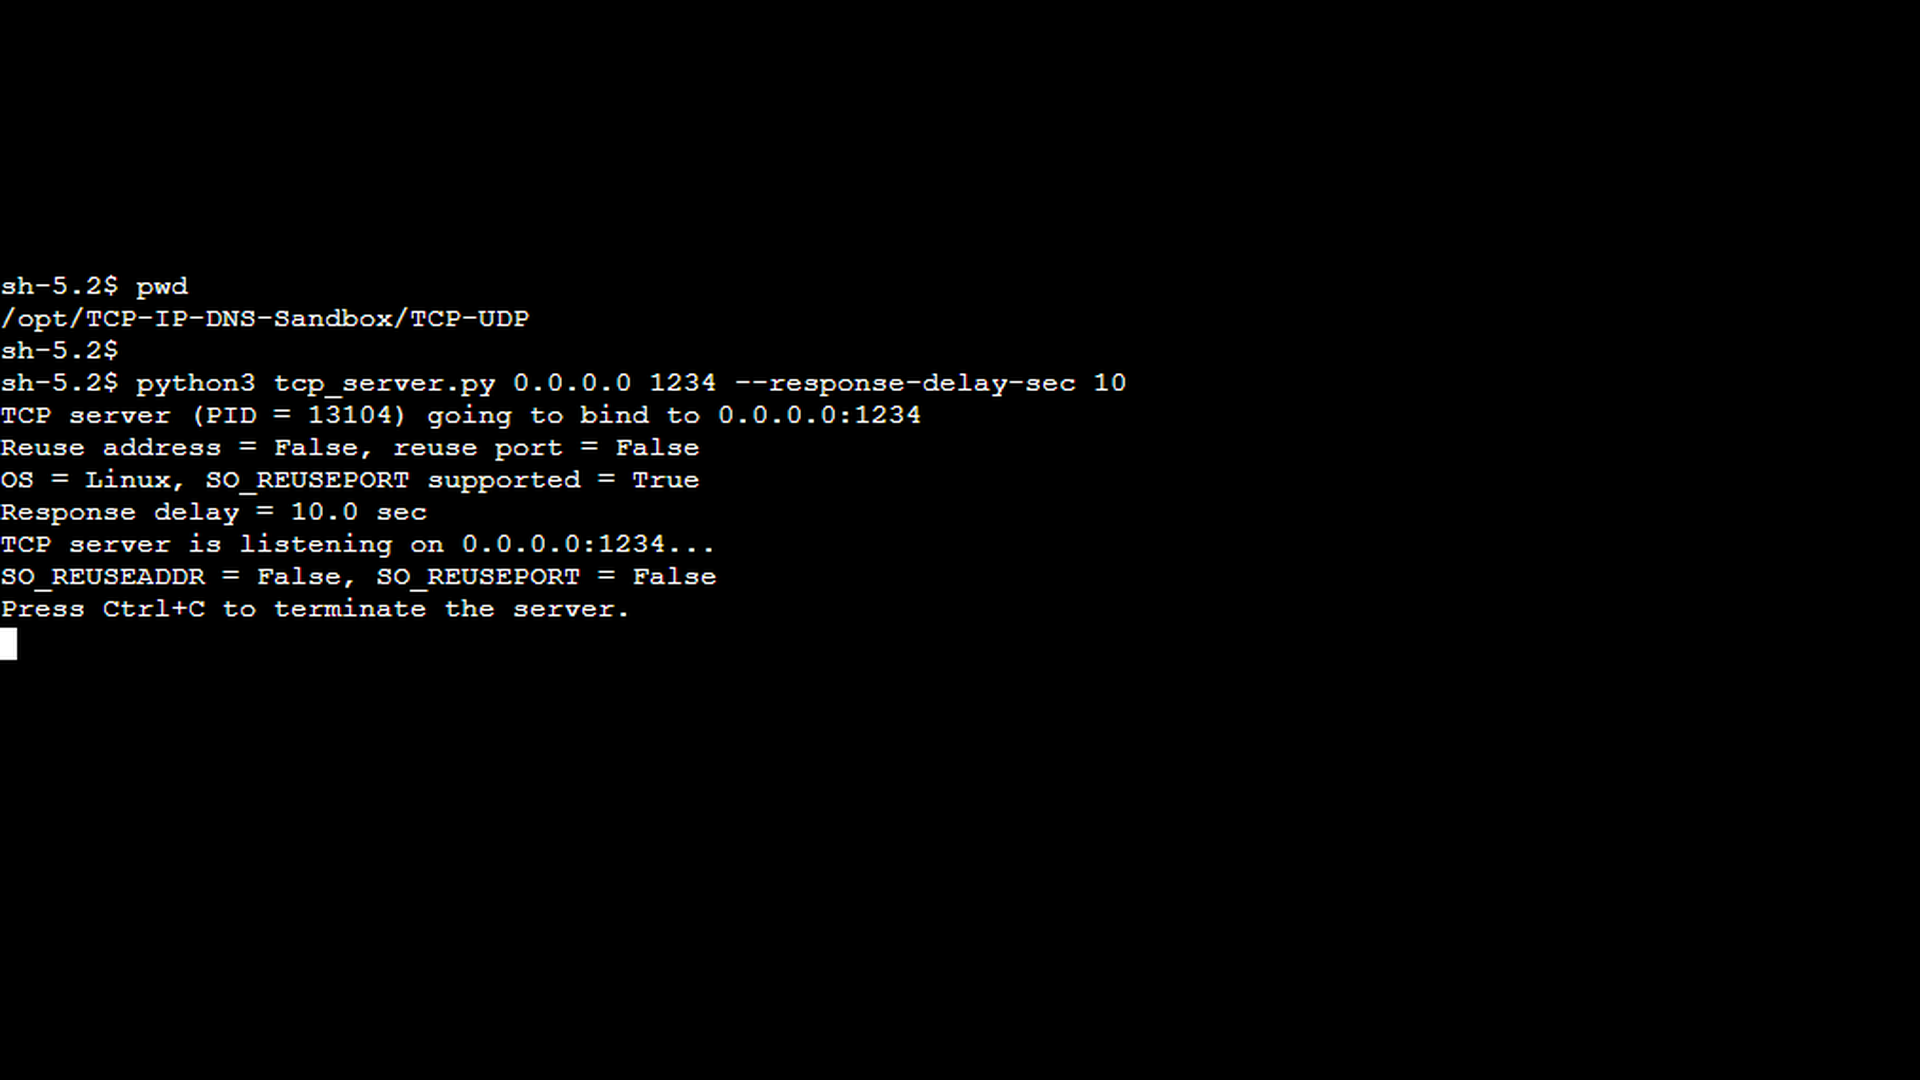
To simulate a delayed response, the TCP server application provides the –response-delay-sec command-line option. When this option is used, the server waits for the specified number of seconds before sending a response to any received message. On the client side, the TCP client application provides the –read-timeout-sec command-line option. When this option is used, the client applies the specified number of seconds as the read timeout while waiting for a response from the server.
In the first scenario, we demonstrate a delayed server response that is still delivered within the client’s read timeout, so no error occurs. This example establishes a baseline and helps distinguish between slow but acceptable responses and responses that actually trigger a read timeout. The first screenshot shows the TCP server started with the –response-delay-sec option set to 10 seconds. This simulates a slow backend or a service that requires additional processing time before responding.
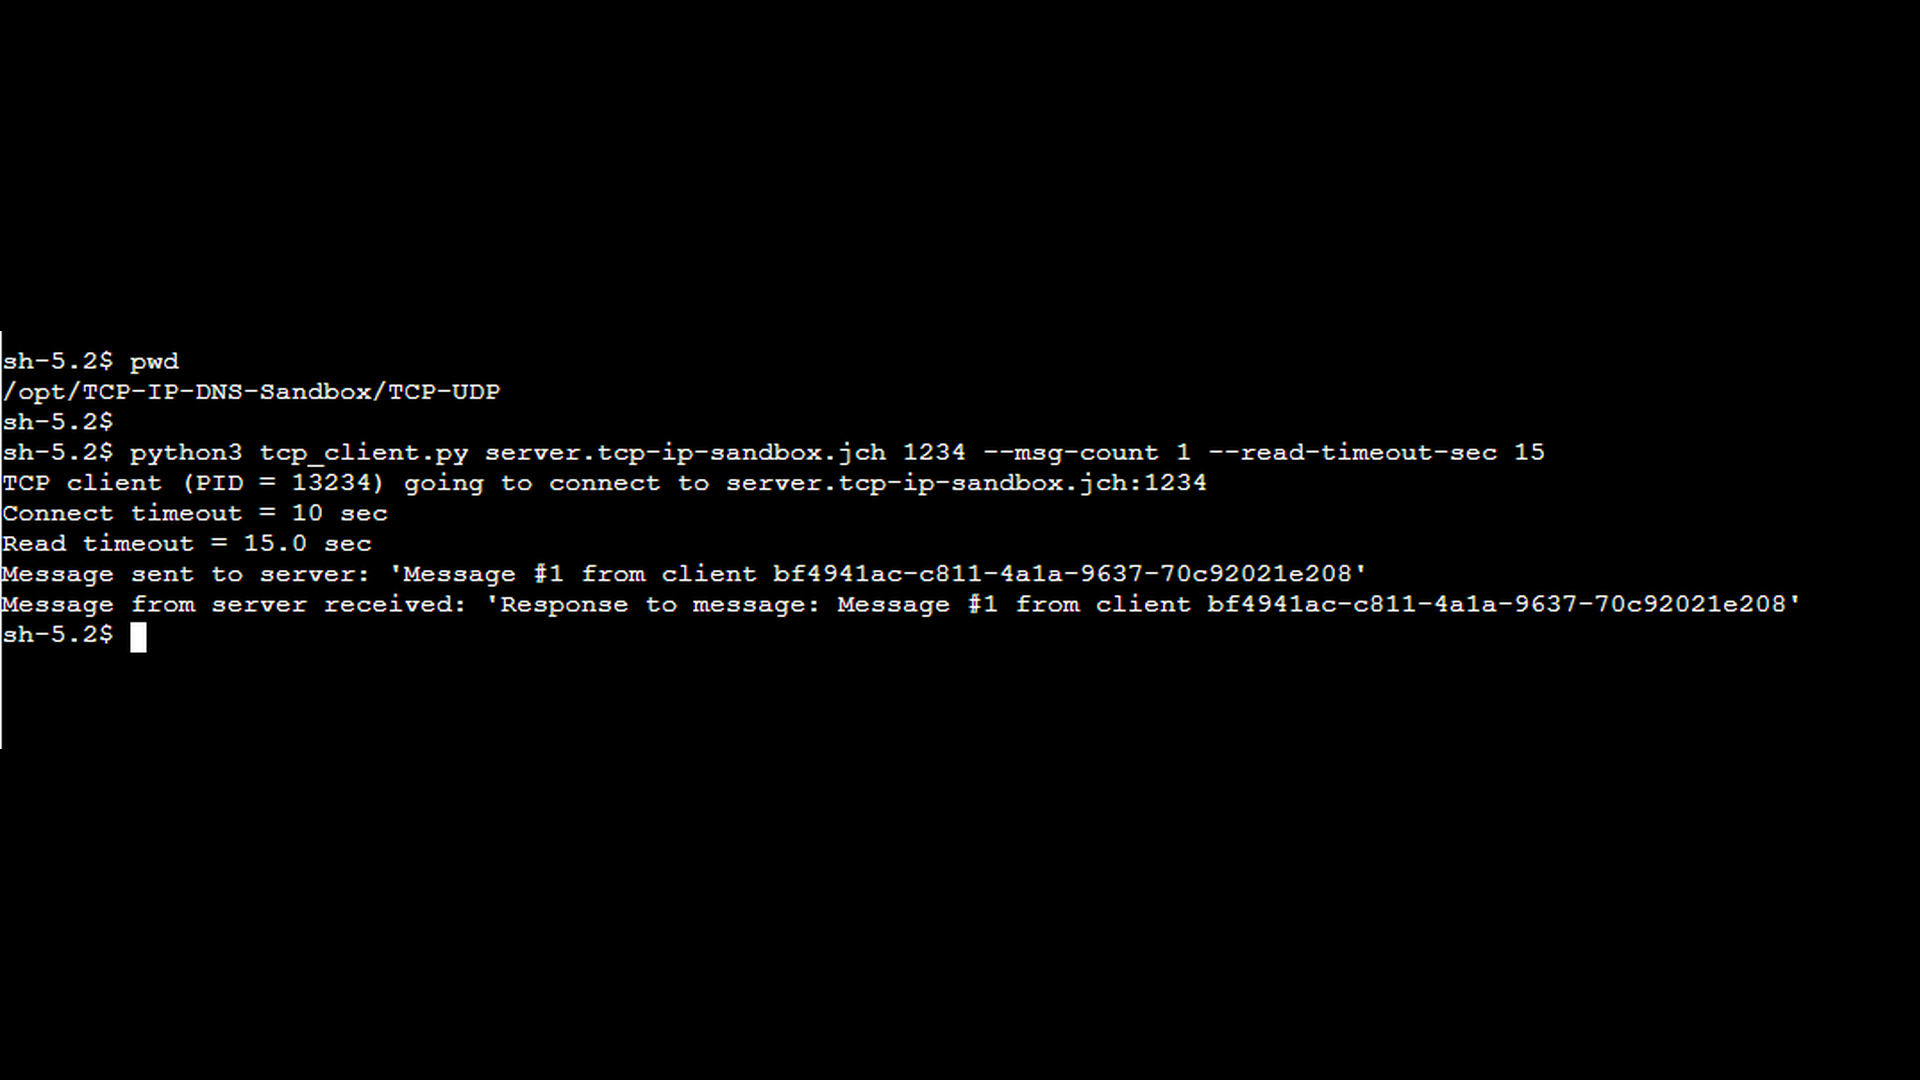
The next screenshot shows the TCP client started with an explicit read timeout using the –read-timeout-sec option. In this scenario, the read timeout is configured to 15 seconds which is longer than the server’s response delay, so the client is willing to wait for the delayed response. For the sake of simplicity, the –msg-count 1 option instructs the client to send only a single message. This ensures that the network capture contains the minimum number of packets necessary to demonstrate the scenario clearly.
The final pair of Wireshark screenshots show a tcpdump capture taken on the client side. The first screenshot shows the message send from the client to the server, the second screenshot shows the response from the server. In the Time column, you can clearly see a noticeable delay (approx. 10 seconds) between the client’s request and the server’s response. However, despite the delay, the response arrives before the read timeout expires, and the client continues operating normally without reporting any error.
This scenario illustrates an important point: a delayed response alone does not imply a read timeout. As long as the response arrives within the configured timeout, the TCP connection remains healthy and the application proceeds without issues.
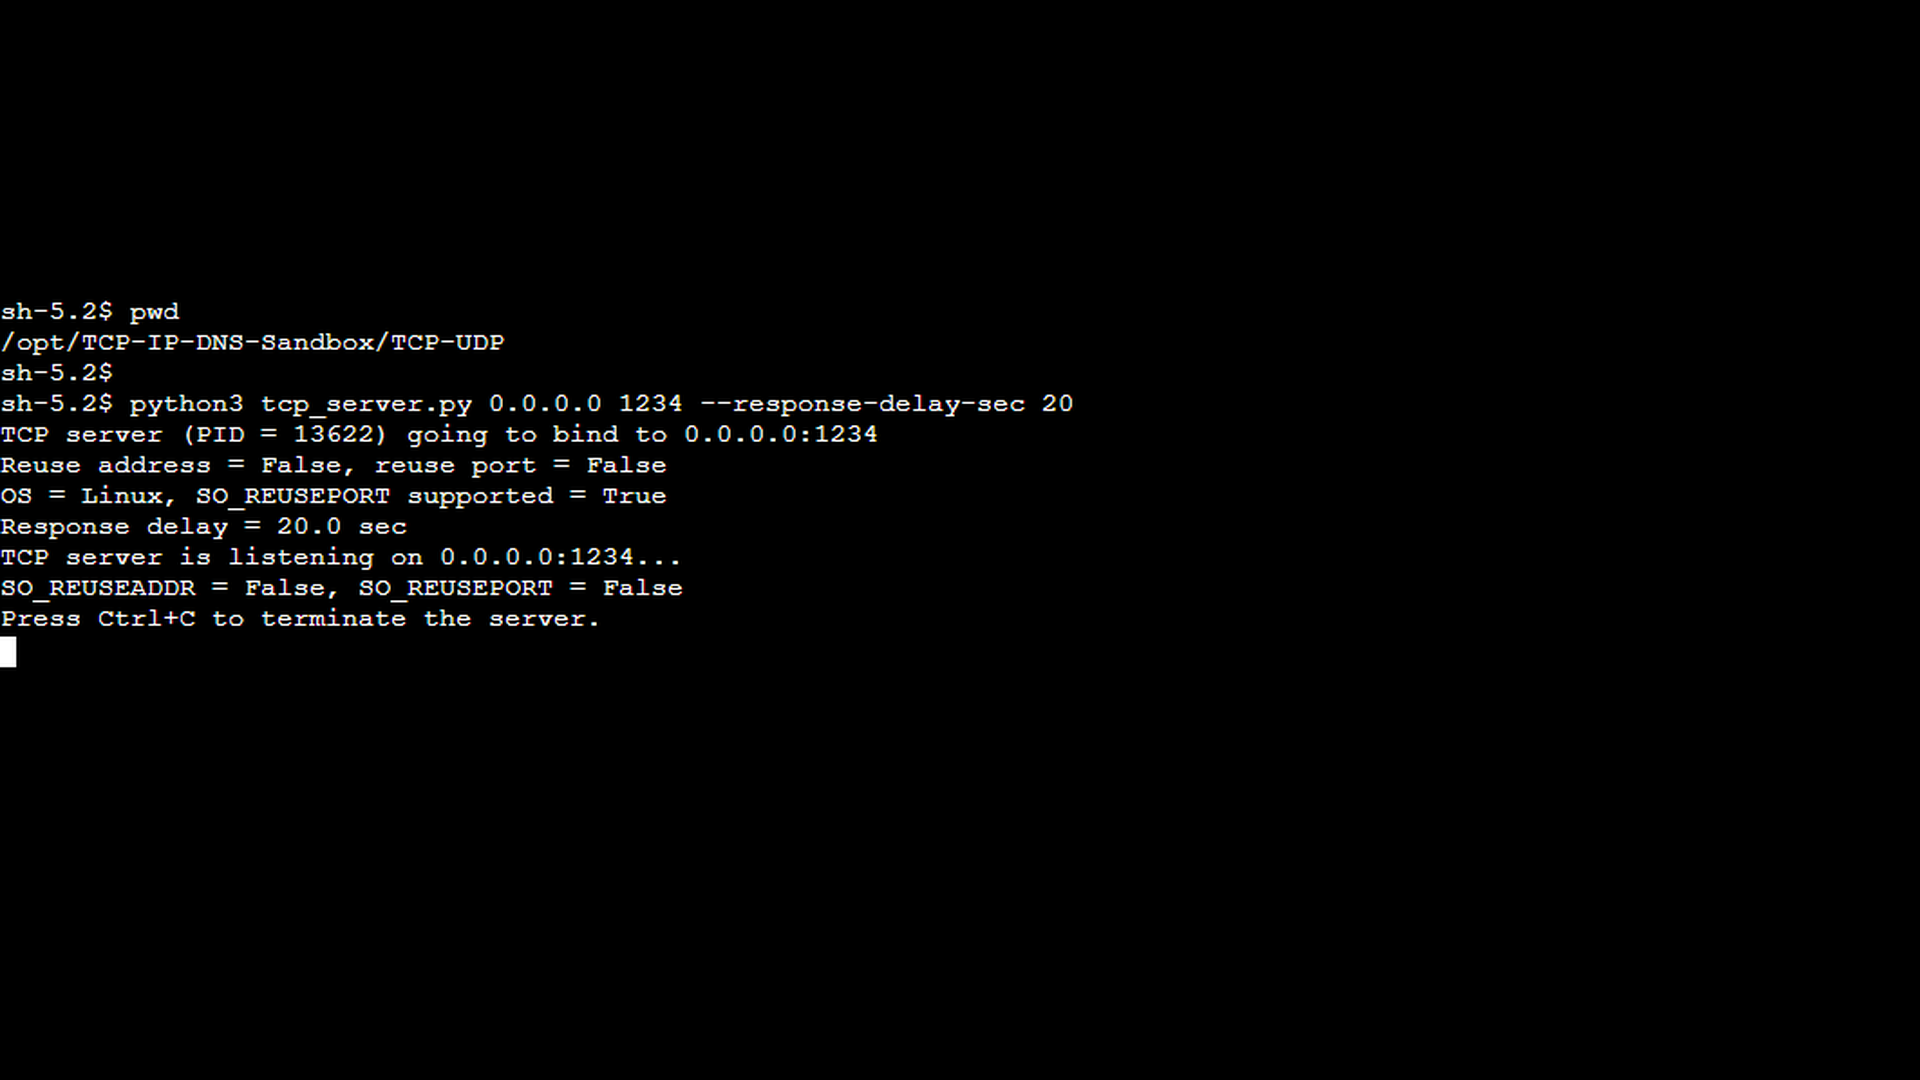
In the second scenario, we use the same setup as before, but this time the server’s response delay exceeds the client’s configured read timeout, causing the read operation to fail. The first screenshot shows the TCP server started with the –response-delay-sec option set to 20 seconds. From the server’s perspective, nothing unusual happens – it receives the client’s message and simply delays the response as instructed.
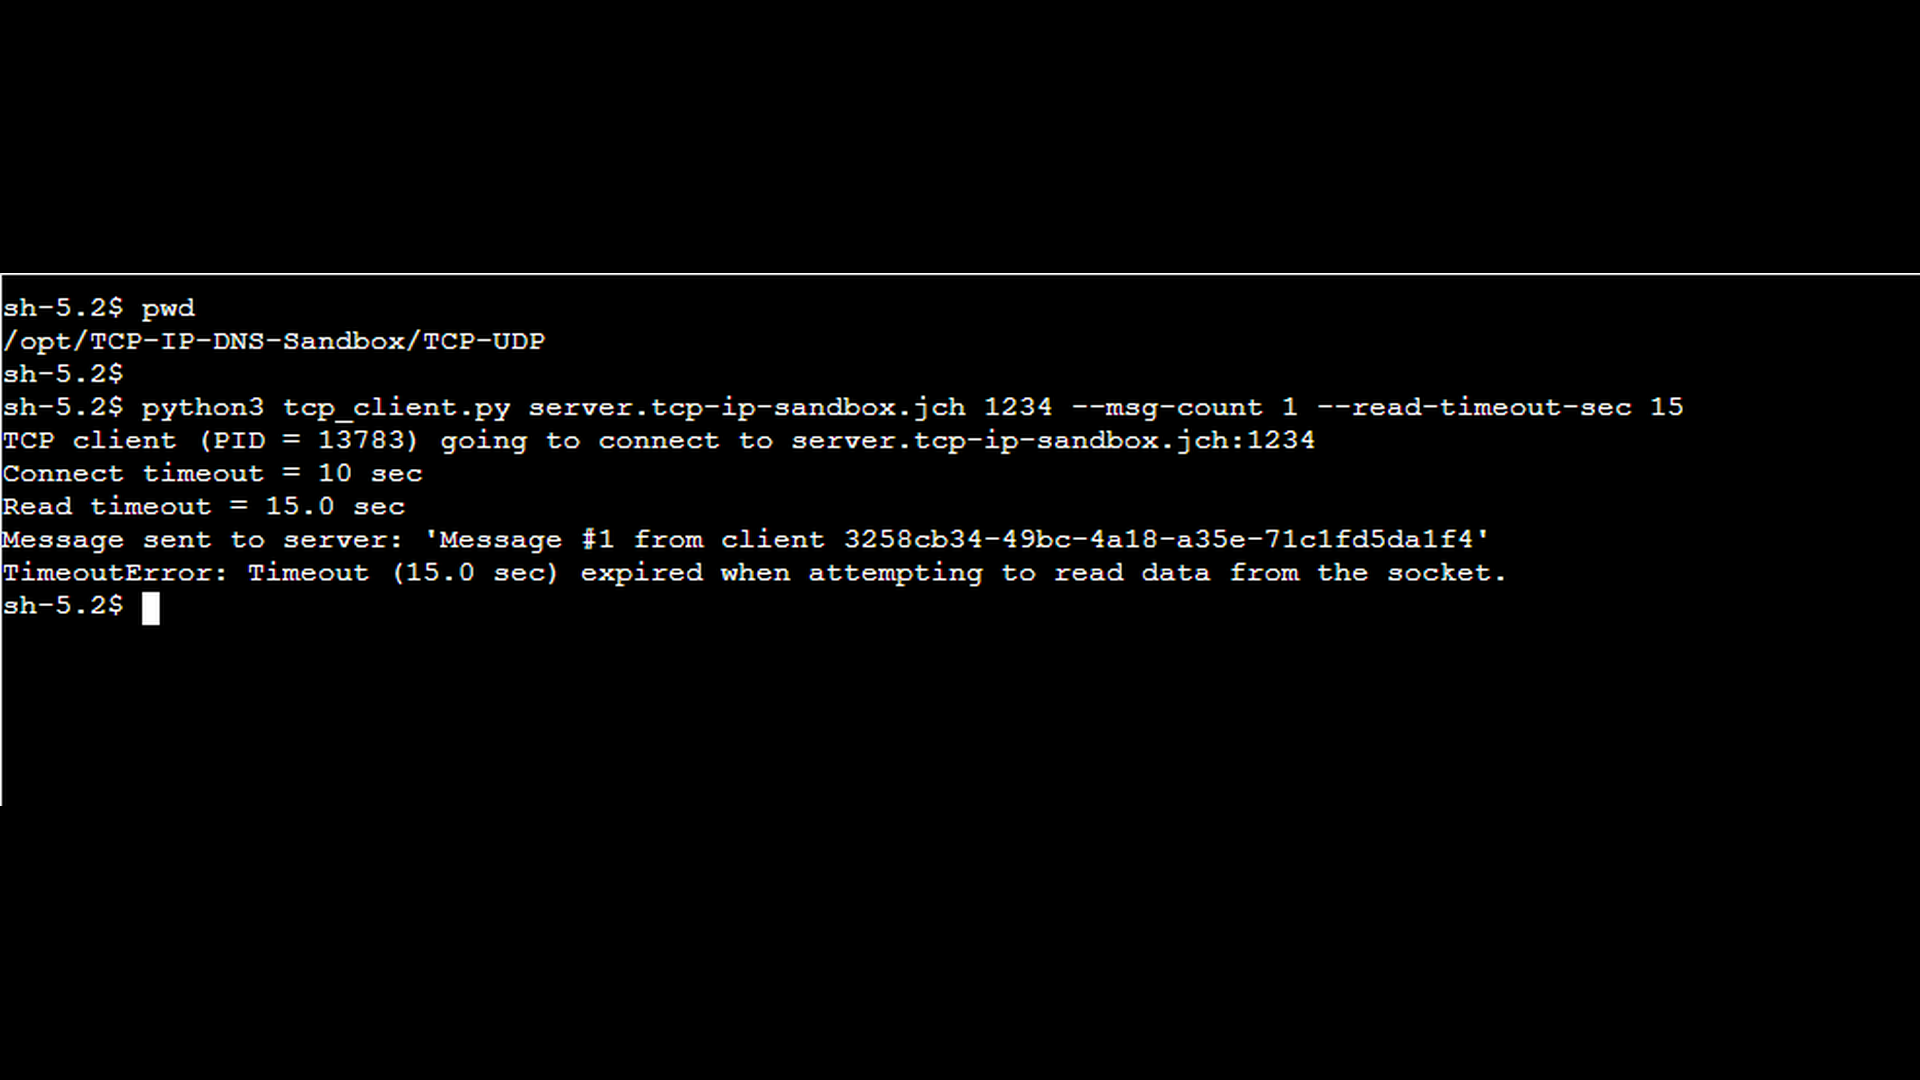
The next screenshot shows the TCP client started with a shorter read timeout using the –read-timeout-sec option. In this scenario, the read timeout is configured to 15 seconds which is shorter than the server’s response delay. Because the timeout is now shorter than the server’s response delay, the client gives up waiting before the response is sent. As in the previous scenario, the –msg-count 1 option instructs the client to send only a single message.
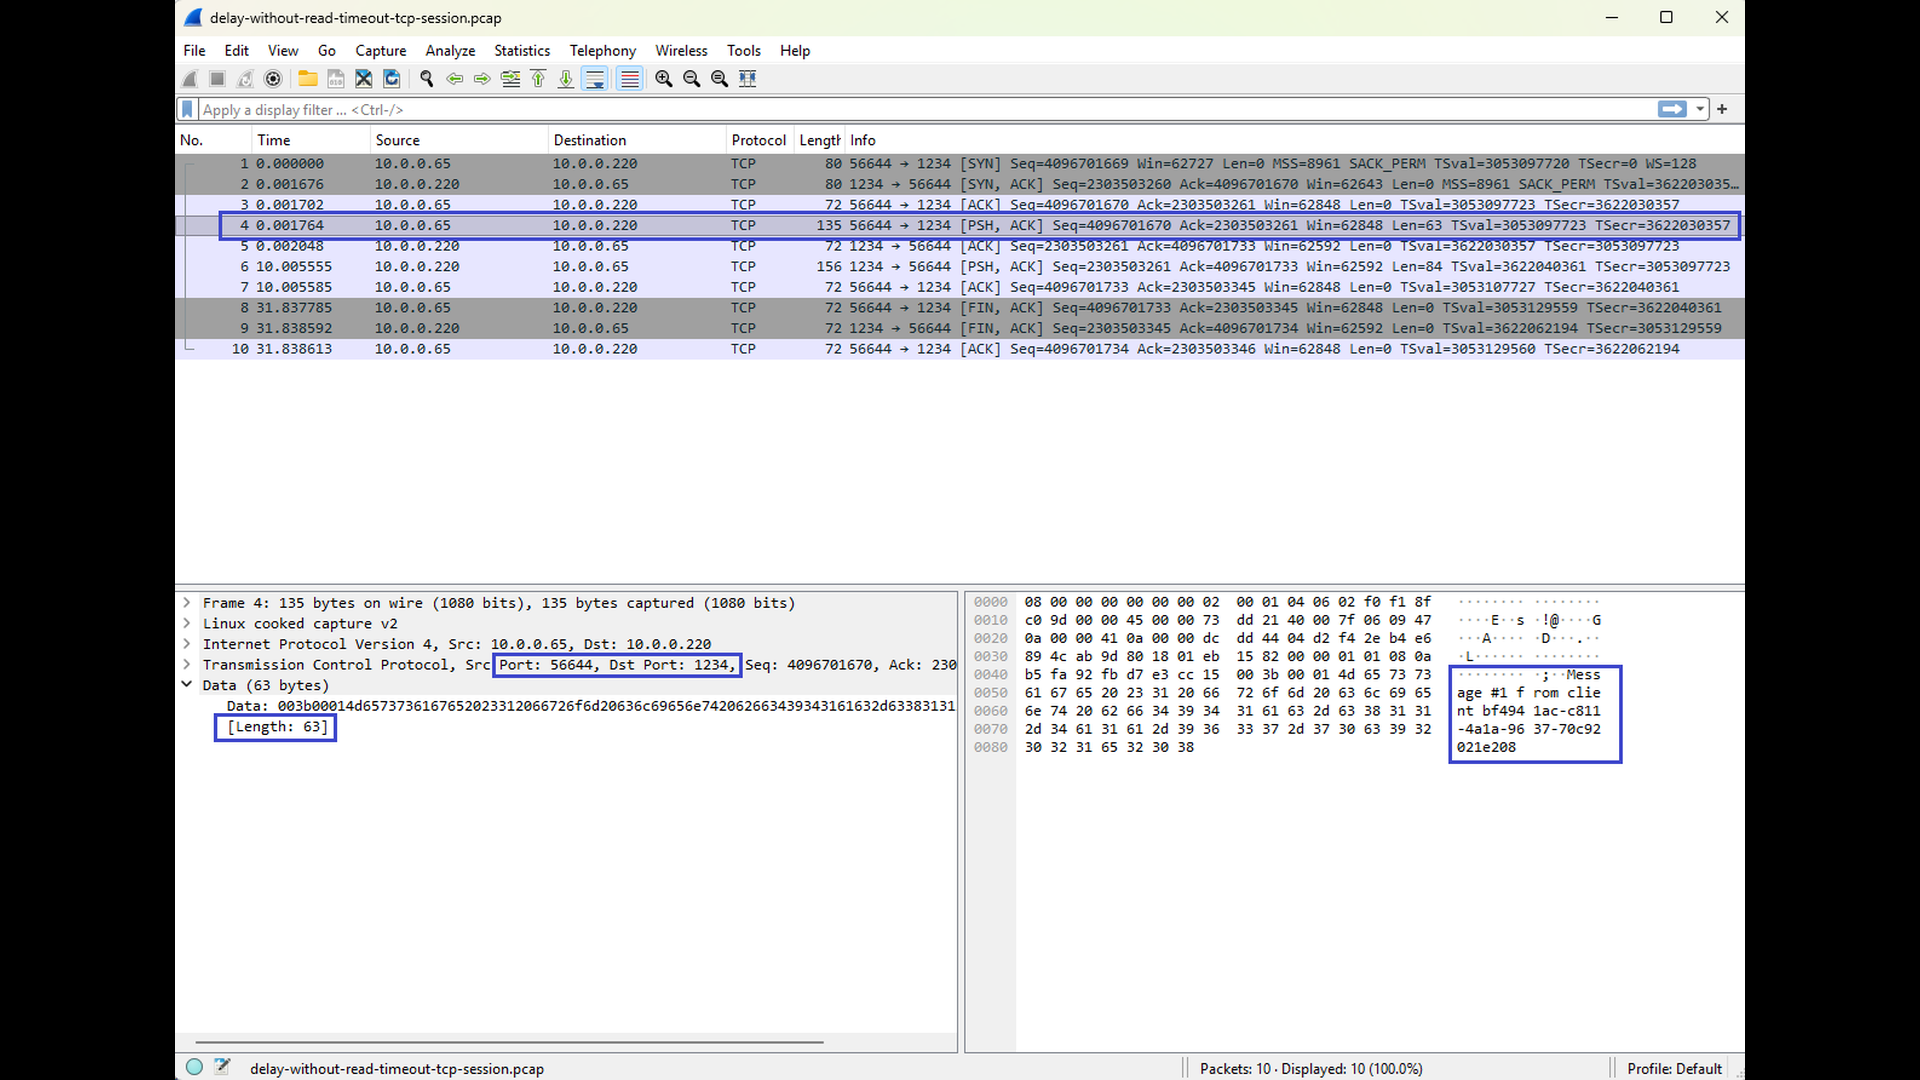
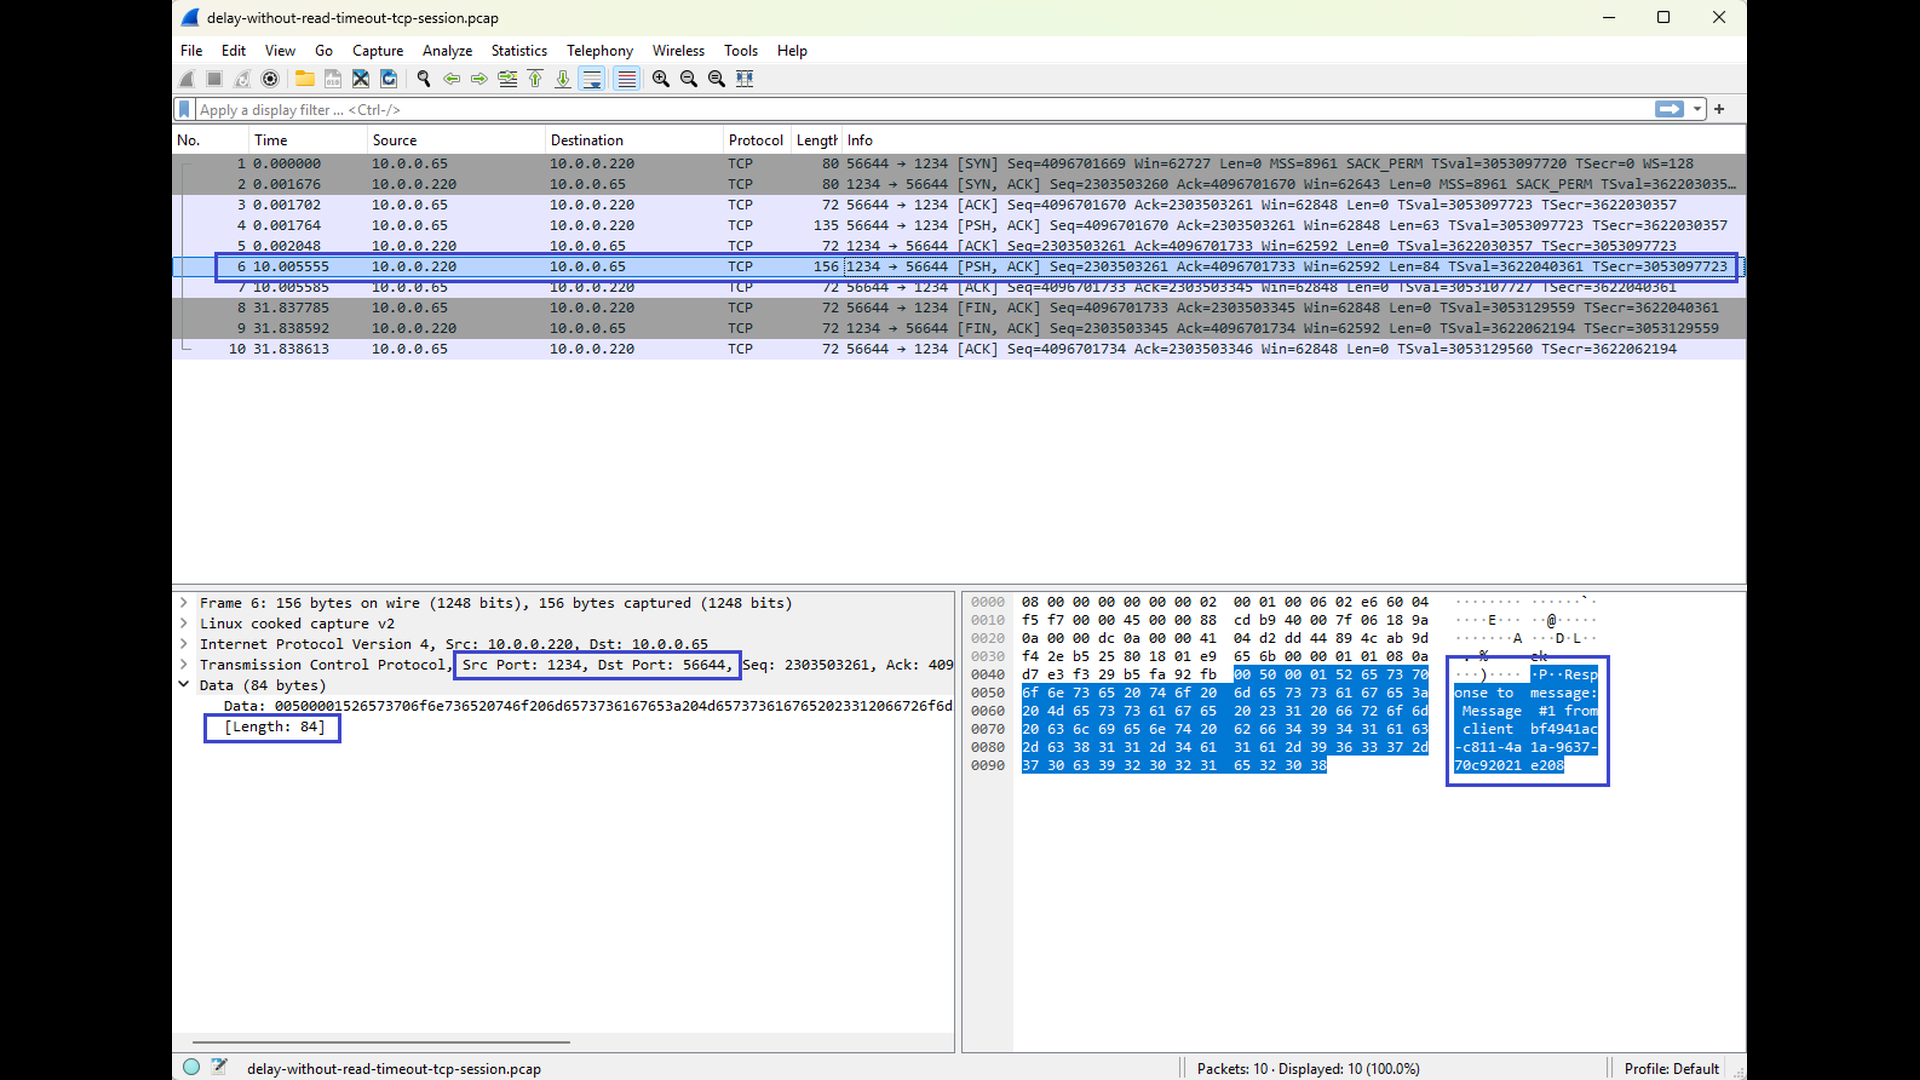
The final pair of Wireshark screenshots shows a tcpdump capture taken on the client side. You can again observe the request being sent from the client to the server, but this time no response arrives before the read timeout expires. The second screenshot shows the response, but it arrives after the expiration of the timeout. As a result, the client reports a “read timeout” error, even though the TCP connection itself could remain established at the protocol level. The screenshots show connection abort (see the RST segments), but this is caused by the fact that the client application terminates after handling the timeout error. In other words, the abort is not caused by the timeout itself, but by the client’s cleanup behavior.

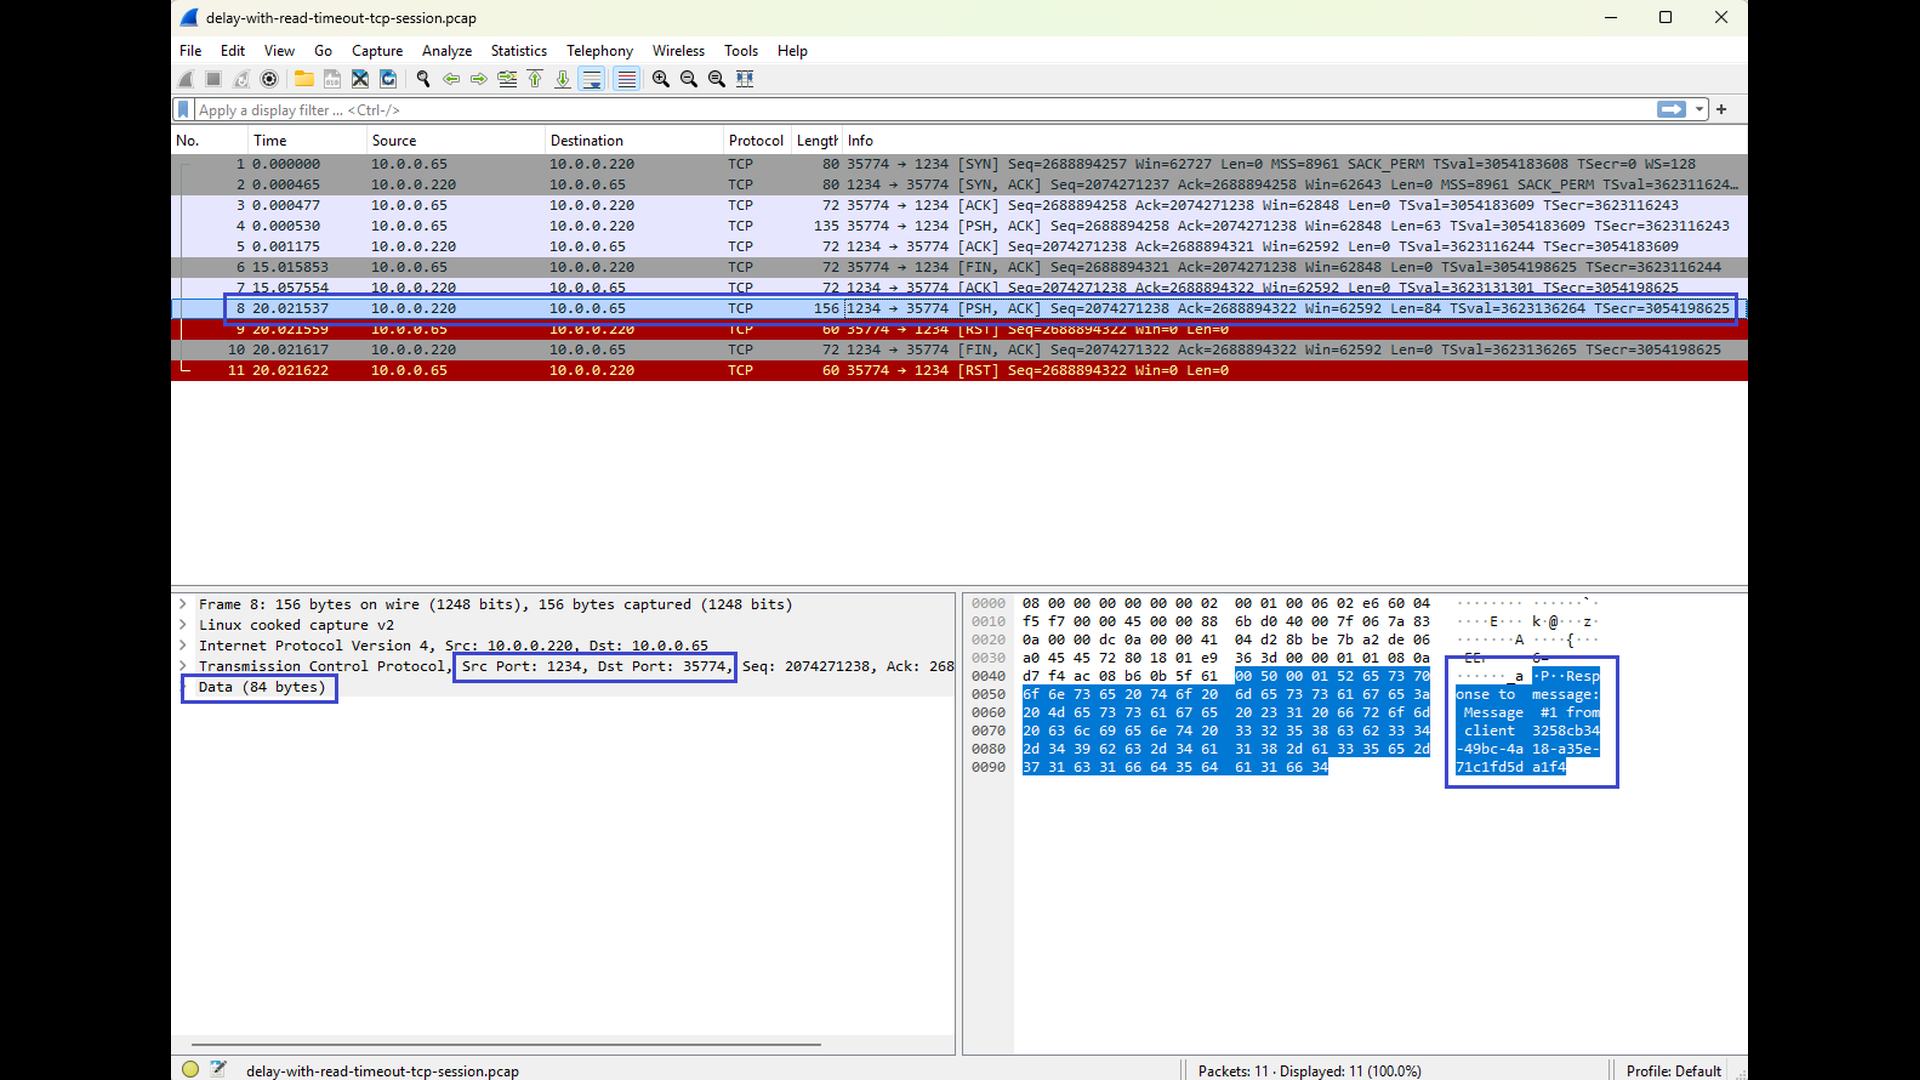
This scenario highlights a key aspect of read timeouts: they are application-level errors, not TCP-level failures. The network path is healthy, no packets are lost, and the server eventually sends a response – but the application is no longer willing to wait. By comparing this scenario with the previous one, it becomes clear that the difference between success and failure lies entirely in the relationship between server response time and client read timeout, not in the TCP connection itself.
Conclusion
A “read timeout” error does not signal a broken TCP connection but rather a situation where an application waits longer than expected for incoming data. Because TCP itself remains established during the timeout, the root cause is almost always higher-level: the remote application is slow to respond, blocked on a dependency, overloaded, or unable to process the request in a timely manner. Packet captures and server-side diagnostics can reveal whether the delay stems from missing packets, delayed acknowledgments, or simply an application that is not producing data fast enough.
In the next part of this series, we will examine the “write timeout” error – the counterpart to the read timeout. Where read timeouts occur when data does not arrive, write timeouts occur when data cannot be sent. This typically happens when the remote endpoint reads too slowly, causing its advertised TCP window to shrink to zero and the sender’s output buffer to fill up. Understanding this behavior completes the picture of how TCP flow control affects both sides of a connection.

